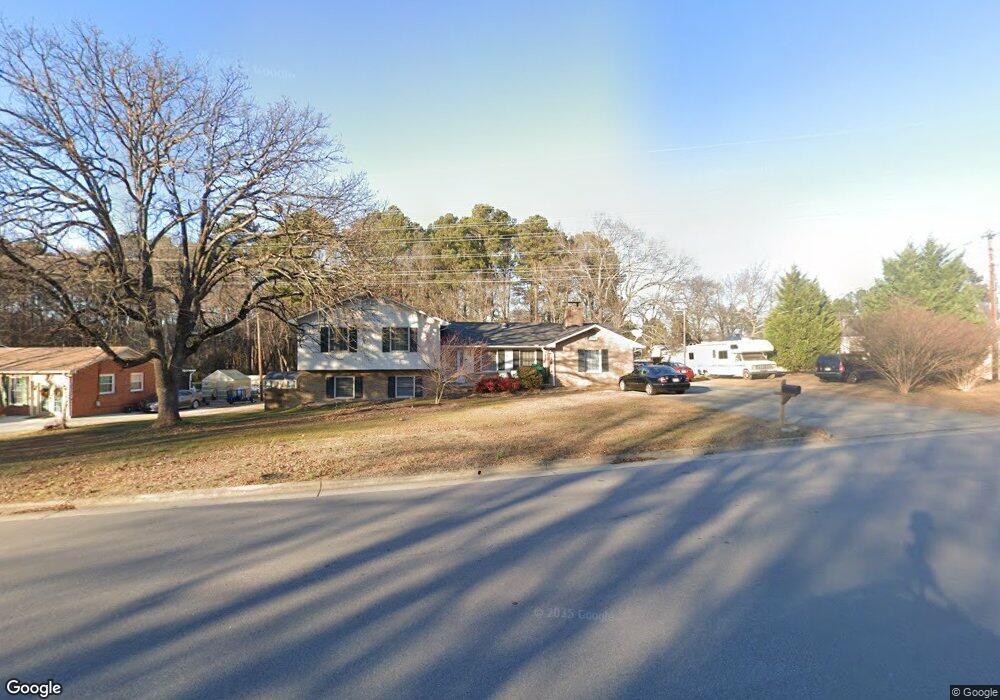
1005 Windcrest Rd Durham, NC 27713
Estimated Value: $310,000 - $408,000
3
Beds
3
Baths
1,713
Sq Ft
$218/Sq Ft
Est. Value
About This Home
This home is located at 1005 Windcrest Rd, Durham, NC 27713 and is currently estimated at $373,822, approximately $218 per square foot. 1005 Windcrest Rd is a home located in Durham County with nearby schools including Pearsontown Elementary School, Lowe's Grove Middle, and Hillside High School.
Ownership History
Date
Name
Owned For
Owner Type
Purchase Details
Closed on
Feb 9, 2007
Sold by
Serrano Pedro S and Serrano Maria Delores
Bought by
Davis Luciene Patrick and Davis Emily A
Current Estimated Value
Home Financials for this Owner
Home Financials are based on the most recent Mortgage that was taken out on this home.
Original Mortgage
$118,500
Outstanding Balance
$69,215
Interest Rate
6.08%
Mortgage Type
Purchase Money Mortgage
Estimated Equity
$304,607
Purchase Details
Closed on
Aug 24, 2006
Sold by
Federal National Mortgage Association
Bought by
Serrano Pedro S and Serrano Maria Delores
Home Financials for this Owner
Home Financials are based on the most recent Mortgage that was taken out on this home.
Original Mortgage
$117,000
Interest Rate
9.62%
Mortgage Type
Purchase Money Mortgage
Purchase Details
Closed on
Nov 16, 2005
Sold by
James Richard D
Bought by
Federal National Mortgage Association
Create a Home Valuation Report for This Property
The Home Valuation Report is an in-depth analysis detailing your home's value as well as a comparison with similar homes in the area
Purchase History
| Date | Buyer | Sale Price | Title Company |
|---|---|---|---|
| Davis Luciene Patrick | $158,000 | None Available | |
| Serrano Pedro S | -- | None Available | |
| Federal National Mortgage Association | $133,002 | -- |
Source: Public Records
Mortgage History
| Date | Status | Borrower | Loan Amount |
|---|---|---|---|
| Open | Davis Luciene Patrick | $118,500 | |
| Closed | Davis Luciene Patrick | $39,500 | |
| Previous Owner | Serrano Pedro S | $117,000 |
Source: Public Records
Tax History
| Year | Tax Paid | Tax Assessment Tax Assessment Total Assessment is a certain percentage of the fair market value that is determined by local assessors to be the total taxable value of land and additions on the property. | Land | Improvement |
|---|---|---|---|---|
| 2025 | $3,526 | $355,718 | $96,250 | $259,468 |
| 2024 | $2,903 | $208,090 | $36,135 | $171,955 |
| 2023 | $2,726 | $208,090 | $36,135 | $171,955 |
| 2022 | $2,663 | $208,090 | $36,135 | $171,955 |
| 2021 | $2,651 | $208,090 | $36,135 | $171,955 |
| 2020 | $2,588 | $208,090 | $36,135 | $171,955 |
| 2019 | $2,588 | $208,090 | $36,135 | $171,955 |
| 2018 | $2,358 | $173,795 | $35,040 | $138,755 |
| 2017 | $2,340 | $173,795 | $35,040 | $138,755 |
| 2016 | $2,261 | $173,795 | $35,040 | $138,755 |
| 2015 | $2,505 | $180,965 | $33,424 | $147,541 |
| 2014 | $2,505 | $180,965 | $33,424 | $147,541 |
Source: Public Records
Map
Nearby Homes
- 1058 Flagler St
- 1062 Flagler St
- 514 Auburn Square Dr
- 1129 Pebble Creek Crossing
- 1001 Pebble Creek Crossing Unit 11
- 8 Drummond Ct
- 1 Chownings St
- 6502 Barbee Rd
- 6500 Amber Springs Dr
- 6519 Amber Springs Dr
- 5624 Barbee Rd
- 63 Lake Village Dr
- 1101 Canary Pepper Dr
- 6004 Tahoe Dr
- 12 Byerly Ct
- 1115 Rocketcress Dr
- 1107 Rocketcress Dr
- 1038 Laceflower Dr
- 1049 Laceflower Dr
- 503 Forge Rd
- 1001 Windcrest Rd
- 6108 Barbee Rd
- 6104 Barbee Rd
- 921 Windcrest Rd
- 1008 Windcrest Rd
- 1004 Windcrest Rd
- 6118 Barbee Rd
- 6100 Barbee Rd
- 6102 Yellowstone Dr
- 917 Windcrest Rd
- 6122 Barbee Rd
- 6020 Barbee Rd
- 6109 Yellowstone Dr
- 913 Windcrest Rd
- 6106 Yellowstone Dr
- 912 Windcrest Rd
- 6016 Barbee Rd
- 1012 Flagler St
- 1018 Flagler St
- 1008 Flagler St