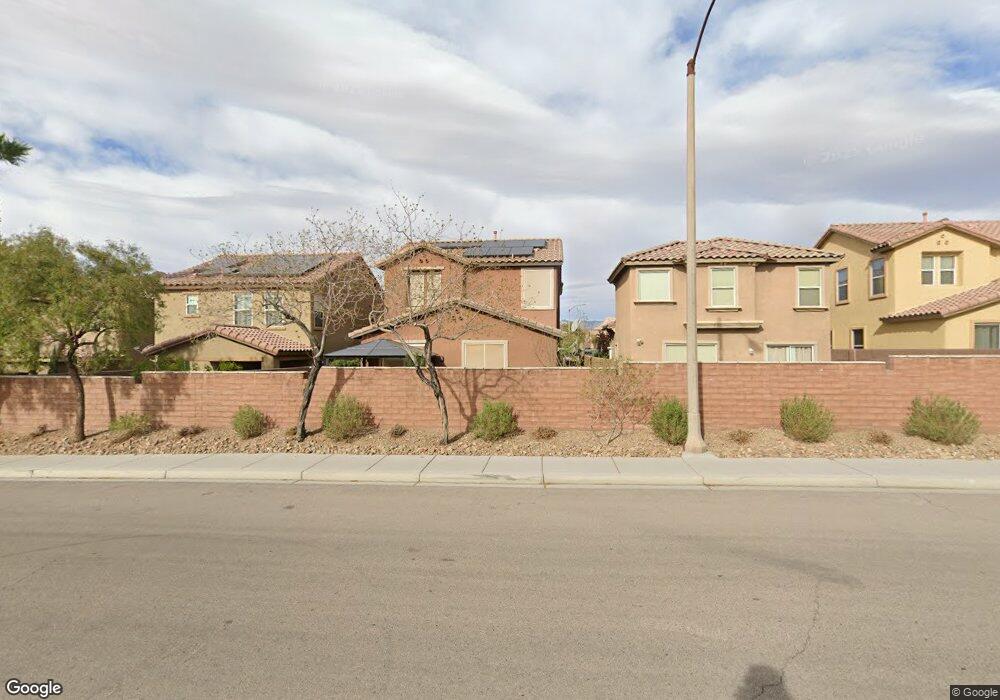
10050 Pimera Alta St Las Vegas, NV 89178
Mountains Edge NeighborhoodEstimated Value: $414,772 - $425,000
3
Beds
3
Baths
1,668
Sq Ft
$251/Sq Ft
Est. Value
About This Home
This home is located at 10050 Pimera Alta St, Las Vegas, NV 89178 and is currently estimated at $418,693, approximately $251 per square foot. 10050 Pimera Alta St is a home located in Clark County with nearby schools including Sierra Vista High School, Doral Academy Cactus, and Good Samaritan Christian Academy.
Ownership History
Date
Name
Owned For
Owner Type
Purchase Details
Closed on
Apr 26, 2017
Sold by
Roy Mark M
Bought by
Roy Mark M and Ellens Trust
Current Estimated Value
Purchase Details
Closed on
Aug 11, 2008
Sold by
The Bank Of New York
Bought by
Roy Mark M
Home Financials for this Owner
Home Financials are based on the most recent Mortgage that was taken out on this home.
Original Mortgage
$188,512
Outstanding Balance
$123,361
Interest Rate
6.27%
Mortgage Type
FHA
Estimated Equity
$295,333
Purchase Details
Closed on
Jun 16, 2008
Sold by
Fikri Adam
Bought by
The Bank Of New York and Certificate Holders Cwabs Inc Asset Back
Home Financials for this Owner
Home Financials are based on the most recent Mortgage that was taken out on this home.
Original Mortgage
$188,512
Outstanding Balance
$123,361
Interest Rate
6.27%
Mortgage Type
FHA
Estimated Equity
$295,333
Purchase Details
Closed on
Aug 29, 2006
Sold by
Kb Home Nevada Inc
Bought by
Fikri Adam
Home Financials for this Owner
Home Financials are based on the most recent Mortgage that was taken out on this home.
Original Mortgage
$232,400
Interest Rate
7.75%
Mortgage Type
New Conventional
Create a Home Valuation Report for This Property
The Home Valuation Report is an in-depth analysis detailing your home's value as well as a comparison with similar homes in the area
Home Values in the Area
Average Home Value in this Area
Purchase History
| Date | Buyer | Sale Price | Title Company |
|---|---|---|---|
| Roy Mark M | -- | None Available | |
| Roy Mark M | $191,000 | First American Title Paseo V | |
| The Bank Of New York | $158,666 | Lsi Title Agency Inc | |
| Fikri Adam | $290,501 | First Amer Title Co Of Nv |
Source: Public Records
Mortgage History
| Date | Status | Borrower | Loan Amount |
|---|---|---|---|
| Open | Roy Mark M | $188,512 | |
| Previous Owner | Fikri Adam | $232,400 |
Source: Public Records
Tax History Compared to Growth
Tax History
| Year | Tax Paid | Tax Assessment Tax Assessment Total Assessment is a certain percentage of the fair market value that is determined by local assessors to be the total taxable value of land and additions on the property. | Land | Improvement |
|---|---|---|---|---|
| 2025 | $1,461 | $111,343 | $35,000 | $76,343 |
| 2024 | $1,419 | $111,343 | $35,000 | $76,343 |
| 2023 | $1,419 | $103,344 | $31,500 | $71,844 |
| 2022 | $1,380 | $92,608 | $26,950 | $65,658 |
| 2021 | $1,341 | $86,880 | $24,500 | $62,380 |
| 2020 | $1,298 | $85,196 | $23,450 | $61,746 |
| 2019 | $1,261 | $81,188 | $20,650 | $60,538 |
| 2018 | $1,239 | $74,756 | $16,800 | $57,956 |
| 2017 | $2,048 | $71,141 | $15,400 | $55,741 |
| 2016 | $1,159 | $59,258 | $11,900 | $47,358 |
| 2015 | $1,157 | $53,541 | $9,800 | $43,741 |
| 2014 | $1,123 | $38,356 | $5,600 | $32,756 |
Source: Public Records
Map
Nearby Homes
- 9237 Weeping Water Ave
- 9283 Tonkawa Ave
- 9250 Wild Stampede Ave
- 9338 Wilderness Glen Ave
- 9072 Sendero Ave
- 9362 Wilderness Glen Ave
- 9141 Castle Valley Ave
- 9846 Black Mulberry St
- 9996 Blue Rain St
- 9825 Emerald Twilight St
- 10259 Wolves Den Ln
- 10069 Desert Azure St
- 9856 Chief Sky St
- 9869 Juno Hills St
- 8955 Harmony Hall Ave
- 8968 Horizon Hyatt Ave
- 10300 S Dapple Gray Rd
- 10267 Running Falls St
- 9745 Wickstead St
- 9076 Bridal Creek Ave
- 10044 Pimera Alta St Unit none
- 10056 Pimera Alta St
- 10038 Pimera Alta St
- 10062 Pimera Alta St
- 10032 Pimera Alta St
- 10068 Pimera Alta St
- 9229 Alta Monte Ct
- 10026 Pimera Alta St Unit none
- 10026 Pimera Alta St
- 10074 Pimera Alta St
- 9235 Alta Monte Ct Unit 1
- 9230 Weeping Water Ave
- 10035 Pimera Alta St
- 10061 Natchez Trace St
- 10069 Natchez Trace St
- 10053 Natchez Trace St
- 10020 Pimera Alta St
- 10077 Natchez Trace St
- 9241 Alta Monte Ct
- 9236 Weeping Water Ave