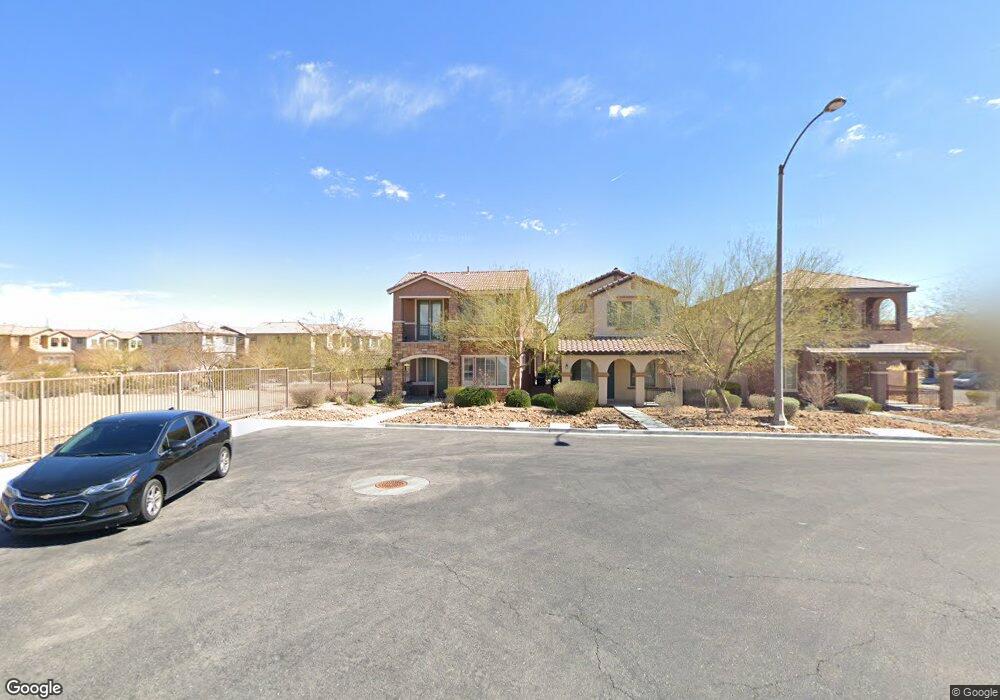
10052 Carlton Gate St Las Vegas, NV 89178
Mountains Edge NeighborhoodEstimated Value: $435,000 - $451,000
4
Beds
3
Baths
1,979
Sq Ft
$224/Sq Ft
Est. Value
About This Home
This home is located at 10052 Carlton Gate St, Las Vegas, NV 89178 and is currently estimated at $444,180, approximately $224 per square foot. 10052 Carlton Gate St is a home located in Clark County with nearby schools including Desert Oasis High School, Doral Academy Cactus, and Good Samaritan Christian Academy.
Ownership History
Date
Name
Owned For
Owner Type
Purchase Details
Closed on
Sep 4, 2025
Sold by
Cabrera Evelyn M
Bought by
Evelyn Cabrera Revocable Living Trust and Cabrera
Current Estimated Value
Purchase Details
Closed on
Jan 26, 2009
Sold by
Deutsche Bank National Trust Company
Bought by
Cabrera Evelyn M
Home Financials for this Owner
Home Financials are based on the most recent Mortgage that was taken out on this home.
Original Mortgage
$140,250
Interest Rate
5.08%
Mortgage Type
Unknown
Purchase Details
Closed on
Oct 16, 2008
Sold by
Wang Yu Qin
Bought by
Deutsche Bank National Trust Co
Purchase Details
Closed on
May 10, 2006
Sold by
Mme Llc
Bought by
Wang Yu Qin
Home Financials for this Owner
Home Financials are based on the most recent Mortgage that was taken out on this home.
Original Mortgage
$342,781
Interest Rate
9.3%
Mortgage Type
Unknown
Create a Home Valuation Report for This Property
The Home Valuation Report is an in-depth analysis detailing your home's value as well as a comparison with similar homes in the area
Home Values in the Area
Average Home Value in this Area
Purchase History
| Date | Buyer | Sale Price | Title Company |
|---|---|---|---|
| Evelyn Cabrera Revocable Living Trust | -- | None Listed On Document | |
| Cabrera Evelyn M | $165,000 | First American Title Paseo V | |
| Deutsche Bank National Trust Co | $312,325 | Cr Title Services Inc | |
| Wang Yu Qin | $380,868 | Land Title Of Nevada |
Source: Public Records
Mortgage History
| Date | Status | Borrower | Loan Amount |
|---|---|---|---|
| Previous Owner | Cabrera Evelyn M | $140,250 | |
| Previous Owner | Wang Yu Qin | $342,781 |
Source: Public Records
Tax History Compared to Growth
Tax History
| Year | Tax Paid | Tax Assessment Tax Assessment Total Assessment is a certain percentage of the fair market value that is determined by local assessors to be the total taxable value of land and additions on the property. | Land | Improvement |
|---|---|---|---|---|
| 2025 | $2,009 | $120,616 | $33,250 | $87,366 |
| 2024 | $1,951 | $120,616 | $33,250 | $87,366 |
| 2023 | $1,951 | $113,962 | $31,500 | $82,462 |
| 2022 | $1,894 | $101,401 | $26,250 | $75,151 |
| 2021 | $1,839 | $95,971 | $24,500 | $71,471 |
| 2020 | $1,783 | $95,135 | $24,500 | $70,635 |
| 2019 | $1,761 | $91,154 | $22,050 | $69,104 |
| 2018 | $1,680 | $79,191 | $17,500 | $61,691 |
| 2017 | $2,235 | $76,210 | $15,750 | $60,460 |
| 2016 | $1,574 | $71,652 | $15,750 | $55,902 |
| 2015 | $1,570 | $59,322 | $12,250 | $47,072 |
| 2014 | $1,521 | $54,101 | $5,250 | $48,851 |
Source: Public Records
Map
Nearby Homes
- 8695 Canfield Canyon Ave
- 8733 Autumn Teal Ave
- 8823 Autumn Teal Ave
- 8749 Brilliant Star Dr
- 10220 Cougar Crossing St
- 10208 Arch Bluff St
- 8626 Anderson Dale Ave
- 8768 Charm Canyon Ave
- 8708 Gateway Glen Dr
- 9864 Maspalomas St
- 10320 Bluff Valley Ct Unit 2
- 10330 Eve Springs St
- 8719 Mount Mira Loma Ave
- 8547 Benidorm Ave
- 10368 Saddle Mountain St
- 10395 Kern Ridge St
- 10260 Hawks Wing St
- 8754 Moon Crater Ave
- 9092 National Park Dr
- 9856 Chief Sky St
- 10058 Carlton Gate St
- 10064 Carlton Gate St
- 10051 Candy Bouquet St
- 10051 Candy Bouquet St Unit n/a
- 10057 Candy Bouquet St
- 10063 Candy Bouquet St
- 10063 Candy Bouquet St Unit 1
- 10063 Carlton Gate St Unit 1
- 10069 Carlton Gate St
- 8696 Diamond Sand Ave Unit na
- 8713 Canfield Canyon Ave
- 8719 Canfield Canyon Ave Unit 1
- 8707 Canfield Canyon Ave
- 10075 Carlton Gate St
- 8701 Canfield Canyon Ave
- 8690 Diamond Sand Ave
- 10081 Carlton Gate St
- 8697 Rowland Bluff Ave
- 8684 Diamond Sand Ave