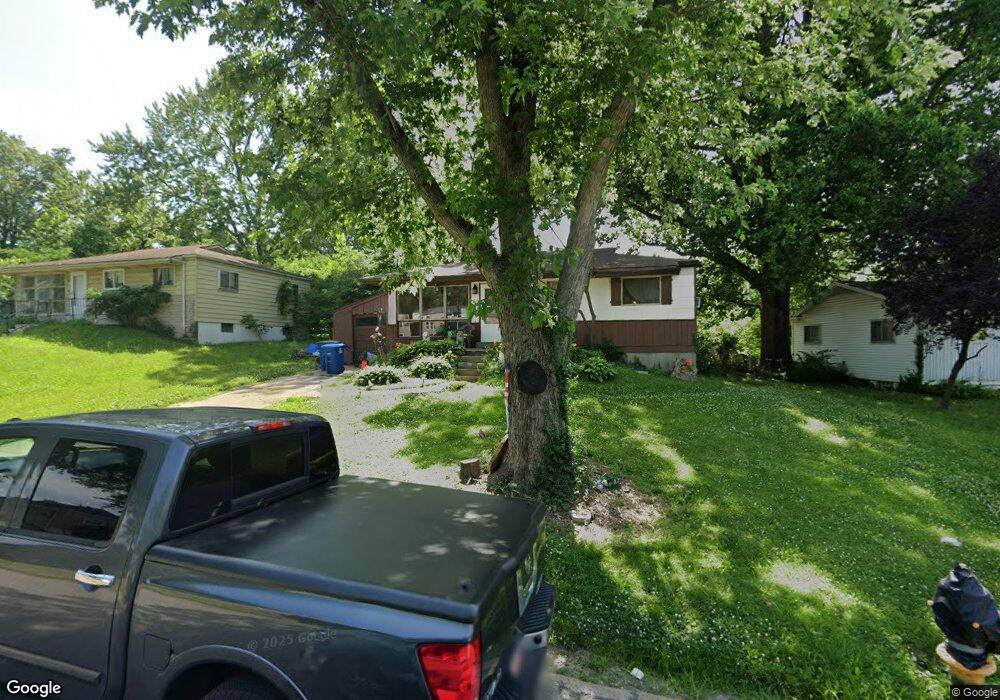
10053 Pepper Ln Saint Louis, MO 63136
Capitol Hill NeighborhoodEstimated Value: $68,000 - $115,285
2
Beds
1
Bath
1,020
Sq Ft
$96/Sq Ft
Est. Value
About This Home
This home is located at 10053 Pepper Ln, Saint Louis, MO 63136 and is currently estimated at $98,071, approximately $96 per square foot. 10053 Pepper Ln is a home located in St. Louis County with nearby schools including Riverview Gardens Senior High School, St. Louis Unified School, and Storman-Lyons Leadership Academy.
Ownership History
Date
Name
Owned For
Owner Type
Purchase Details
Closed on
Aug 1, 2024
Sold by
Jbs Properties Llc
Bought by
Jam Group Llc
Current Estimated Value
Home Financials for this Owner
Home Financials are based on the most recent Mortgage that was taken out on this home.
Original Mortgage
$100,800
Outstanding Balance
$98,152
Interest Rate
6.86%
Mortgage Type
New Conventional
Estimated Equity
-$81
Purchase Details
Closed on
Apr 24, 2024
Sold by
Askew William
Bought by
Jrad Investments Llc and Mckinley
Purchase Details
Closed on
Jan 25, 2024
Sold by
Askew William
Bought by
Jrad Investments Llc and Mckinley
Purchase Details
Closed on
Dec 18, 2023
Sold by
Misuracq Anthony
Bought by
Askew William
Purchase Details
Closed on
Dec 11, 2023
Sold by
Anthony Misuracq
Bought by
Askew William
Purchase Details
Closed on
Apr 3, 2023
Sold by
Misuraca Anthony
Bought by
Askew William
Create a Home Valuation Report for This Property
The Home Valuation Report is an in-depth analysis detailing your home's value as well as a comparison with similar homes in the area
Home Values in the Area
Average Home Value in this Area
Purchase History
| Date | Buyer | Sale Price | Title Company |
|---|---|---|---|
| Jam Group Llc | -- | Title Partners | |
| Jbs Properties Llc | -- | Title Partners | |
| Jbs Properties Llc | -- | Title Partners | |
| Jrad Investments Llc | -- | None Listed On Document | |
| Jrad Investments Llc | -- | None Listed On Document | |
| Askew William | $4,500 | None Listed On Document | |
| Askew William | $4,500 | None Listed On Document | |
| Askew William | $4,500 | None Listed On Document |
Source: Public Records
Mortgage History
| Date | Status | Borrower | Loan Amount |
|---|---|---|---|
| Open | Jam Group Llc | $100,800 |
Source: Public Records
Tax History
| Year | Tax Paid | Tax Assessment Tax Assessment Total Assessment is a certain percentage of the fair market value that is determined by local assessors to be the total taxable value of land and additions on the property. | Land | Improvement |
|---|---|---|---|---|
| 2025 | $1,063 | $11,670 | $400 | $11,270 |
| 2024 | $1,063 | $10,000 | $1,600 | $8,400 |
| 2023 | $1,047 | $10,000 | $1,600 | $8,400 |
| 2022 | $839 | $6,330 | $1,600 | $4,730 |
| 2021 | $836 | $6,330 | $1,600 | $4,730 |
| 2020 | $548 | $4,550 | $1,240 | $3,310 |
| 2019 | $540 | $4,550 | $1,240 | $3,310 |
| 2018 | $713 | $5,790 | $890 | $4,900 |
| 2017 | $705 | $5,790 | $890 | $4,900 |
| 2016 | $901 | $7,540 | $1,270 | $6,270 |
Source: Public Records
Map
Nearby Homes
- 9858 Green Valley Dr
- 9818 Jacobi Ave
- 10038 Balboa Dr
- 10155 Cloverdale Dr
- 2014 Kappel Dr
- 10093 Viscount Dr
- 9833 Balboa Dr
- 10147 Mayfair Dr
- 10040 Monarch Dr
- 10021 Baron Dr
- 9717 Winkler Dr
- 2241 Empress Dr
- 9850 Monarch Dr
- 1920 Crown Point Dr
- 9739 Balboa Dr
- 10121 Baron Dr
- 10035 Clairmont Dr
- 9708 Ventura Dr
- 10228 Viscount Dr
- 9614 Winkler Dr
- 10047 Pepper Ln
- 10059 Pepper Ln
- 10043 Pepper Ln
- 10052 Pepper Ln
- 10048 Pepper Ln
- 10065 Pepper Ln
- 10039 Pepper Ln
- 10067 Pepper Ln
- 10064 Pepper Ln
- 10060 Pepper Ln
- 10040 Pepper Ln
- 10035 Pepper Ln
- 10036 Pepper Ln
- 1736 Kappel(free Appliances+bonus) Dr
- 10031 Pepper Ln
- 10032 Pepper Ln
- 2041 Baroque Ct
- 10027 Pepper Ln
- 10028 Pepper Ln
- 2141 Territory Ct
Your Personal Tour Guide
Ask me questions while you tour the home.