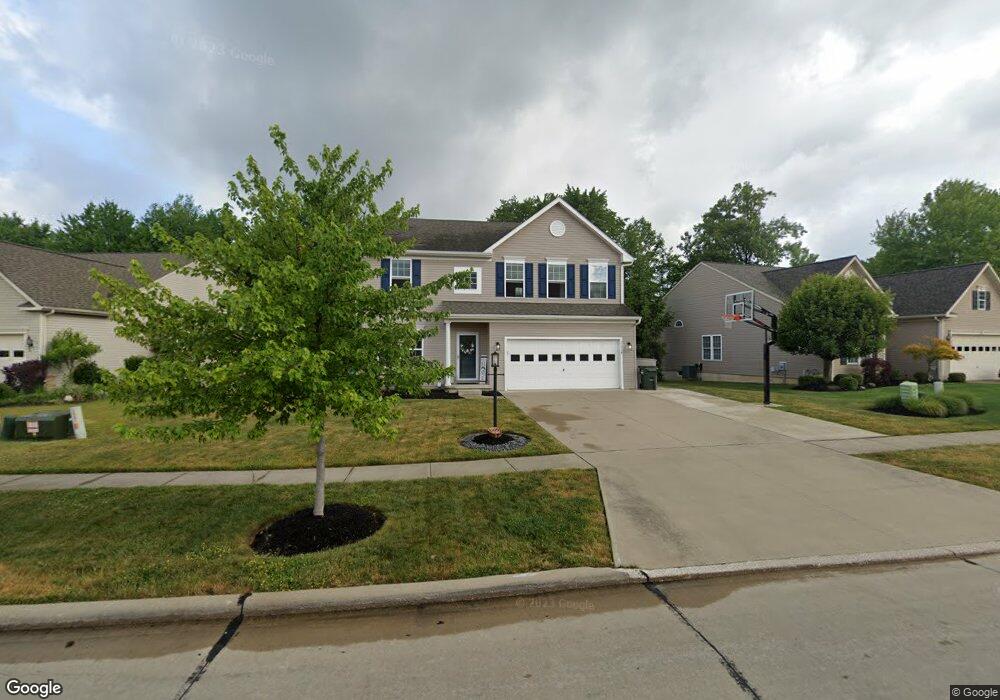
10056 Bentley Dr North Royalton, OH 44133
Estimated Value: $418,369 - $490,000
3
Beds
3
Baths
2,316
Sq Ft
$196/Sq Ft
Est. Value
About This Home
This home is located at 10056 Bentley Dr, North Royalton, OH 44133 and is currently estimated at $454,592, approximately $196 per square foot. 10056 Bentley Dr is a home located in Cuyahoga County with nearby schools including North Royalton Middle School, North Royalton High School, and Saint Albert the Great Roman Catholic School.
Ownership History
Date
Name
Owned For
Owner Type
Purchase Details
Closed on
Mar 13, 2018
Sold by
Johnson Courtney K and August Kenneth R
Bought by
Sefcik Jason and Sefcik Jennifer L
Current Estimated Value
Home Financials for this Owner
Home Financials are based on the most recent Mortgage that was taken out on this home.
Original Mortgage
$216,000
Outstanding Balance
$184,388
Interest Rate
4.22%
Mortgage Type
Purchase Money Mortgage
Estimated Equity
$270,204
Purchase Details
Closed on
Mar 5, 2009
Sold by
Nvr Inc
Bought by
Johnson Courtney K and August Kenneth R
Home Financials for this Owner
Home Financials are based on the most recent Mortgage that was taken out on this home.
Original Mortgage
$198,800
Interest Rate
5.22%
Mortgage Type
Purchase Money Mortgage
Purchase Details
Closed on
Jan 9, 2009
Sold by
York/Royalton Llc
Bought by
Nvr Inc and Ryan Homes
Home Financials for this Owner
Home Financials are based on the most recent Mortgage that was taken out on this home.
Original Mortgage
$198,800
Interest Rate
5.22%
Mortgage Type
Purchase Money Mortgage
Create a Home Valuation Report for This Property
The Home Valuation Report is an in-depth analysis detailing your home's value as well as a comparison with similar homes in the area
Home Values in the Area
Average Home Value in this Area
Purchase History
| Date | Buyer | Sale Price | Title Company |
|---|---|---|---|
| Sefcik Jason | $264,000 | First Source Title | |
| Johnson Courtney K | $209,390 | Nvr Title Agency Llc | |
| Nvr Inc | $55,000 | Nvr Title Agency |
Source: Public Records
Mortgage History
| Date | Status | Borrower | Loan Amount |
|---|---|---|---|
| Open | Sefcik Jason | $216,000 | |
| Previous Owner | Johnson Courtney K | $198,800 |
Source: Public Records
Tax History Compared to Growth
Tax History
| Year | Tax Paid | Tax Assessment Tax Assessment Total Assessment is a certain percentage of the fair market value that is determined by local assessors to be the total taxable value of land and additions on the property. | Land | Improvement |
|---|---|---|---|---|
| 2024 | $7,575 | $130,410 | $24,465 | $105,945 |
| 2023 | $5,720 | $90,310 | $20,270 | $70,040 |
| 2022 | $5,681 | $90,300 | $20,270 | $70,040 |
| 2021 | $5,741 | $90,300 | $20,270 | $70,040 |
| 2020 | $5,752 | $86,000 | $19,290 | $66,710 |
| 2019 | $5,584 | $245,700 | $55,100 | $190,600 |
| 2018 | $5,254 | $86,000 | $19,290 | $66,710 |
| 2017 | $5,036 | $71,580 | $15,470 | $56,110 |
| 2016 | $4,729 | $71,580 | $15,470 | $56,110 |
| 2015 | $4,728 | $71,580 | $15,470 | $56,110 |
| 2014 | $4,684 | $70,350 | $15,470 | $54,880 |
Source: Public Records
Map
Nearby Homes
- 9710 Cove Dr Unit 23G
- 9660 Cove Dr Unit F13
- 9530 Cove Dr Unit C-25
- 9510 Cove Dr Unit C12
- 9800 Cove Dr Unit H2
- 9611 Sunrise Blvd Unit K2
- 11550 York Rd
- 9821 Sunrise Blvd Unit o1
- 9761 Sunrise Blvd
- 10364 Independence Dr Unit 19c
- 10342 Independence Dr Unit 21B
- 10560 Independence Dr Unit 25A
- 11445 Harbour Light Dr
- 10641 Albion Rd
- 11650 Harbour Light Dr Unit 1650
- 9035 Wallings Rd
- 11806 Harbour Light Dr Unit 1806
- 10700 Abbey Rd
- 12906 Cartwright Pkwy
- 13000 Cartwright Pkwy
- 10026 Bentley Dr
- 10086 Bentley Dr
- 9976 Bentley Dr
- 10116 Bentley Dr
- 10051 Bentley Dr
- 10021 Bentley Dr
- 10081 Bentley Dr
- 10146 Bentley Dr
- 9946 Bentley Dr
- 10111 Bentley Dr
- 11175 Coventry Ct
- 10141 Bentley Dr
- 10176 Bentley Dr
- 11208 Coventry Ct
- 9916 Bentley Dr
- 10206 Bentley Dr
- 9911 Bentley Dr
- 10171 Bentley Dr
- 11238 Coventry Ct
- 10201 Bentley Dr