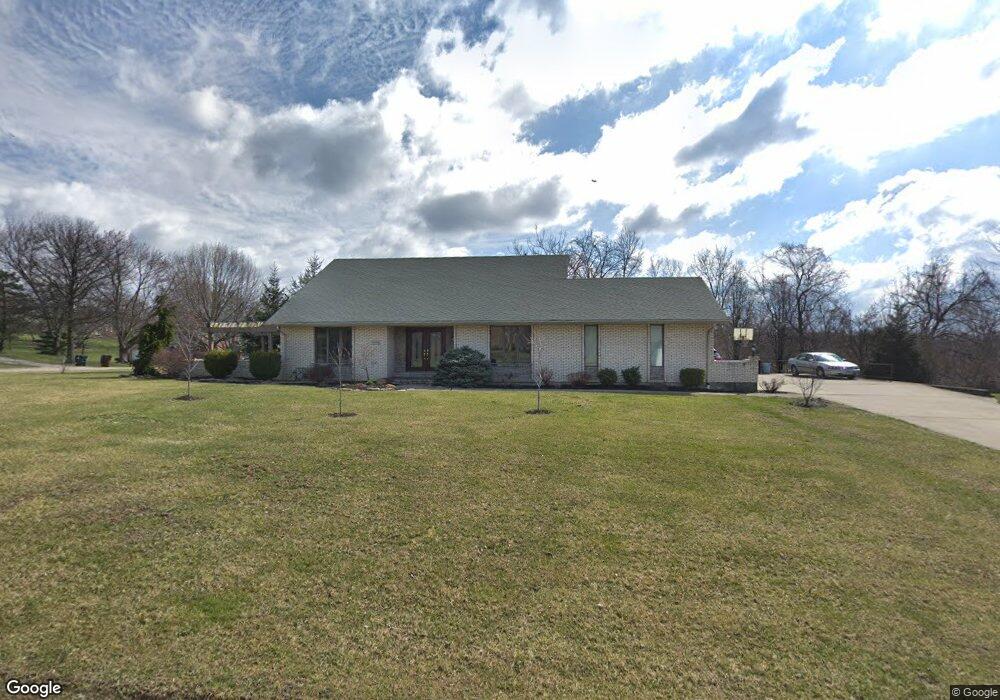
10056 Pebblecreek Ln Cincinnati, OH 45252
Estimated Value: $452,533 - $501,000
4
Beds
4
Baths
3,629
Sq Ft
$132/Sq Ft
Est. Value
About This Home
This home is located at 10056 Pebblecreek Ln, Cincinnati, OH 45252 and is currently estimated at $479,883, approximately $132 per square foot. 10056 Pebblecreek Ln is a home located in Hamilton County with nearby schools including Colerain Elementary School, Colerain Middle School, and Colerain High School.
Ownership History
Date
Name
Owned For
Owner Type
Purchase Details
Closed on
Nov 30, 2010
Sold by
Whitaker Donald and Whitaker Kathleen J
Bought by
Crase Bryan O and Crase Ann E
Current Estimated Value
Home Financials for this Owner
Home Financials are based on the most recent Mortgage that was taken out on this home.
Original Mortgage
$180,000
Interest Rate
4.22%
Mortgage Type
Unknown
Purchase Details
Closed on
Dec 27, 2005
Sold by
Texter Leonard R and Texter Joan A
Bought by
Whitaker Donald and Whitaker Kathleen J
Purchase Details
Closed on
Jan 19, 1996
Sold by
Kuhlman Stephen L
Bought by
Texter Leonard R and Texter Joan A
Home Financials for this Owner
Home Financials are based on the most recent Mortgage that was taken out on this home.
Original Mortgage
$120,000
Interest Rate
7.28%
Create a Home Valuation Report for This Property
The Home Valuation Report is an in-depth analysis detailing your home's value as well as a comparison with similar homes in the area
Home Values in the Area
Average Home Value in this Area
Purchase History
| Date | Buyer | Sale Price | Title Company |
|---|---|---|---|
| Crase Bryan O | $225,000 | Prominent Title | |
| Whitaker Donald | $233,000 | None Available | |
| Texter Leonard R | -- | -- |
Source: Public Records
Mortgage History
| Date | Status | Borrower | Loan Amount |
|---|---|---|---|
| Previous Owner | Crase Bryan O | $180,000 | |
| Previous Owner | Texter Leonard R | $120,000 |
Source: Public Records
Tax History
| Year | Tax Paid | Tax Assessment Tax Assessment Total Assessment is a certain percentage of the fair market value that is determined by local assessors to be the total taxable value of land and additions on the property. | Land | Improvement |
|---|---|---|---|---|
| 2025 | $7,238 | $123,998 | $19,250 | $104,748 |
| 2024 | $6,704 | $123,998 | $19,250 | $104,748 |
| 2023 | $6,738 | $123,998 | $19,250 | $104,748 |
| 2022 | $6,124 | $91,896 | $19,075 | $72,821 |
| 2021 | $6,071 | $91,896 | $19,075 | $72,821 |
| 2020 | $6,131 | $91,896 | $19,075 | $72,821 |
| 2019 | $6,022 | $84,308 | $17,500 | $66,808 |
| 2018 | $5,408 | $84,308 | $17,500 | $66,808 |
| 2017 | $5,128 | $84,308 | $17,500 | $66,808 |
| 2016 | $4,620 | $74,813 | $16,625 | $58,188 |
| 2015 | $4,663 | $74,813 | $16,625 | $58,188 |
| 2014 | $4,671 | $74,813 | $16,625 | $58,188 |
| 2013 | $4,692 | $78,750 | $17,500 | $61,250 |
Source: Public Records
Map
Nearby Homes
- 9873 Kittywood Dr
- 4771 Dry Ridge Rd
- 5630 Dry Ridge Rd
- 9905 Regatta Dr
- 9981 Skyridge Dr
- 4187 Intrepid Dr Unit 38
- 9801 Regatta Dr
- 9800 Regatta Dr
- 4230 Endeavor Dr Unit 101
- 4221 Endeavor Dr
- 4086 Resolute Cir Unit 481
- 4002 Resolute Cir
- 3918 Enterprise Cir Unit 532
- 3834 Enterprise Cir
- 10263 Colerain Ave
- 3724 Yellowstone Dr
- 10232 Roppelt Rd
- 9952 Capstan Dr
- 5801 Day Rd
- 5822 Day Rd
- 5179 Pebblevalley Dr
- 10044 Pebblecreek Ln
- 5165 Pebblevalley Dr
- 10053 Pebblecreek Ln
- 10061 Pebblecreek Ln
- 10039 Pebblecreek Ln
- 5186 Pebblevalley Dr
- 5153 Pebblevalley Dr
- 10077 Pebblecreek Ln
- 10036 Pebblecreek Ln
- 5178 Pebblevalley Dr
- 10085 Pebblecreek Ln
- 10031 Pebblecreek Ln
- 5170 Pebblevalley Dr
- 10098 Pebblecreek Ln
- 5145 Pebblevalley Dr
- 10065 Pebblecreek Ln
- 5175 Dry Ridge Rd
- 10028 Pebblecreek Ln
- 5160 Pebblevalley Dr
Your Personal Tour Guide
Ask me questions while you tour the home.