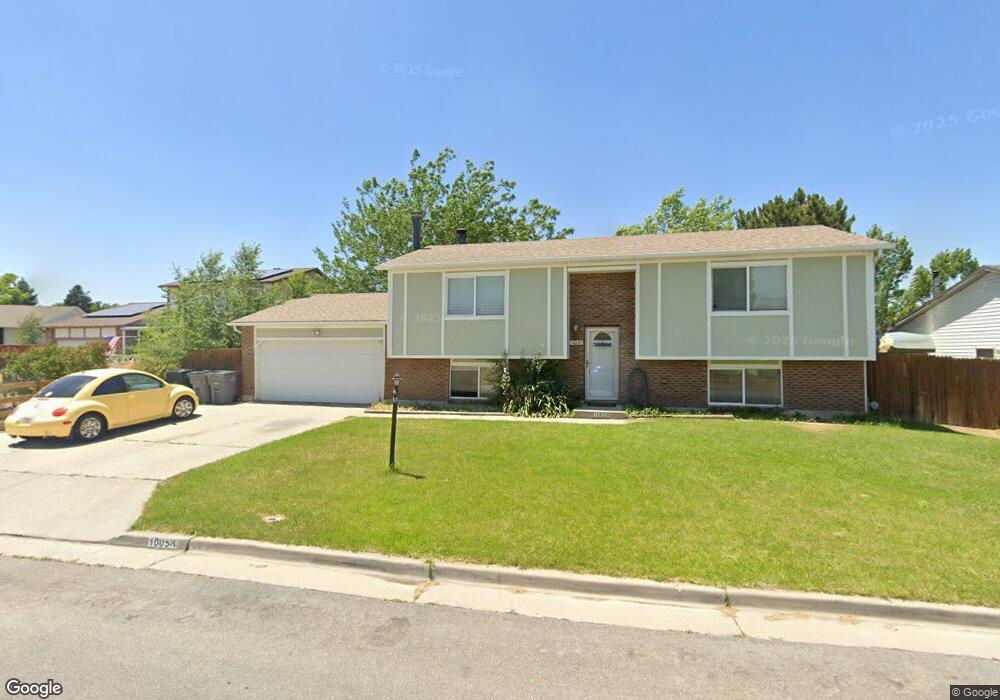
10058 Bagpiper Cir South Jordan, UT 84095
Glenmoor Country Estates NeighborhoodEstimated Value: $512,000 - $592,000
4
Beds
2
Baths
2,114
Sq Ft
$253/Sq Ft
Est. Value
About This Home
This home is located at 10058 Bagpiper Cir, South Jordan, UT 84095 and is currently estimated at $534,977, approximately $253 per square foot. 10058 Bagpiper Cir is a home located in Salt Lake County with nearby schools including Welby Elementary School, Elk Ridge Middle School, and Mountain West Montessori Academy.
Ownership History
Date
Name
Owned For
Owner Type
Purchase Details
Closed on
Apr 29, 2005
Sold by
Depaz Luis R and Depaz William A
Bought by
M & D Hendricksen Rental Llc
Current Estimated Value
Purchase Details
Closed on
Jan 18, 2000
Sold by
Smith Mayo W and Smith Felice S
Bought by
Depaz Luis R and Depaz William A
Home Financials for this Owner
Home Financials are based on the most recent Mortgage that was taken out on this home.
Original Mortgage
$144,806
Interest Rate
7.84%
Mortgage Type
FHA
Purchase Details
Closed on
Nov 18, 1999
Sold by
Cater Patricia A
Bought by
Smith Mayo W and Smith Felice S
Purchase Details
Closed on
Jan 19, 1999
Sold by
Reed Cyndee Anne
Bought by
Cater Patricia Ann
Create a Home Valuation Report for This Property
The Home Valuation Report is an in-depth analysis detailing your home's value as well as a comparison with similar homes in the area
Home Values in the Area
Average Home Value in this Area
Purchase History
| Date | Buyer | Sale Price | Title Company |
|---|---|---|---|
| M & D Hendricksen Rental Llc | -- | Bartlett Title Ins Agcy | |
| Depaz Luis R | -- | First American Title | |
| Smith Mayo W | -- | First American Title | |
| Smith Mayo W | $106,000 | -- | |
| Cater Patricia Ann | -- | -- | |
| Reed Cyndee Anne | -- | -- |
Source: Public Records
Mortgage History
| Date | Status | Borrower | Loan Amount |
|---|---|---|---|
| Previous Owner | Depaz Luis R | $144,806 |
Source: Public Records
Tax History Compared to Growth
Tax History
| Year | Tax Paid | Tax Assessment Tax Assessment Total Assessment is a certain percentage of the fair market value that is determined by local assessors to be the total taxable value of land and additions on the property. | Land | Improvement |
|---|---|---|---|---|
| 2025 | $2,321 | $449,500 | $149,900 | $299,600 |
| 2024 | $2,321 | $440,600 | $147,100 | $293,500 |
| 2023 | $2,440 | $437,200 | $142,800 | $294,400 |
| 2022 | $2,519 | $442,300 | $140,000 | $302,300 |
| 2021 | $1,933 | $311,400 | $109,100 | $202,300 |
| 2020 | $1,957 | $295,600 | $109,100 | $186,500 |
| 2019 | $1,903 | $282,500 | $102,900 | $179,600 |
| 2018 | $1,625 | $240,000 | $102,900 | $137,100 |
| 2017 | $1,532 | $221,700 | $102,900 | $118,800 |
| 2016 | $1,543 | $211,600 | $102,900 | $108,700 |
| 2015 | $1,619 | $215,900 | $104,900 | $111,000 |
| 2014 | $1,557 | $204,000 | $100,000 | $104,000 |
Source: Public Records
Map
Nearby Homes
- 4072 W Ascot Downs Dr
- 4058 W Ascot Downs Dr
- 9941 Birnam Woods Way
- 3928 W Kilt St
- 4246 W Ascot Downs Dr
- 4208 W Chestnut View Dr
- 10164 Birnam Woods Way
- 9851 S Birdie Way
- 10376 S 3970 W
- Raddison Plan at Eagles Landing
- Wembly Plan at Eagles Landing
- Whitmore Plan at Eagles Landing
- Richmond Plan at Eagles Landing
- Regal Plan at Eagles Landing
- Wesley Plan at Eagles Landing
- 3651 W 10200 S Unit 11
- 7196 Sage Creek Rd
- 4554 Birdie Way
- 10448 S Sage Vista Way
- 4091 W Juniper Hills Dr
- 10058 S Bagpiper Cir
- 10072 Bagpiper Cir
- 10072 S Bagpiper Cir
- 10046 Bagpiper Cir
- 10071 S Shetland Cir
- 10059 Shetland Cir
- 10059 S Shetland Cir
- 10071 Shetland Cir
- 10045 Shetland Cir
- 10059 Bagpiper Cir
- 10071 S Bagpiper Cir
- 10071 Bagpiper Cir
- 10045 Bagpiper Cir
- 10045 S Bagpiper Cir
- 10078 Bagpiper Cir
- 10079 Shetland Cir
- 10079 S Shetland Cir
- 4092 W Bonar Bridge Rd
- 4092 Bonar Bridge Rd
- 10085 Bagpiper Cir