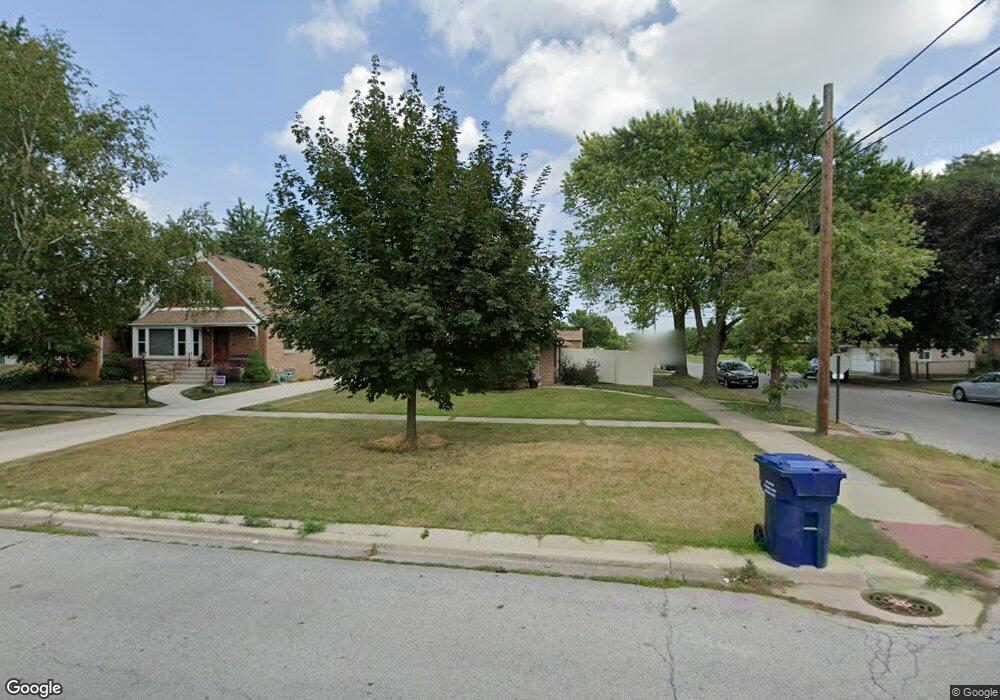
10059 S Spaulding Ave Evergreen Park, IL 60805
Estimated Value: $269,000 - $306,000
3
Beds
1
Bath
1,170
Sq Ft
$244/Sq Ft
Est. Value
About This Home
This home is located at 10059 S Spaulding Ave, Evergreen Park, IL 60805 and is currently estimated at $285,636, approximately $244 per square foot. 10059 S Spaulding Ave is a home located in Cook County with nearby schools including Southwest Elementary School, Central Jr High School, and Evergreen Park High School.
Ownership History
Date
Name
Owned For
Owner Type
Purchase Details
Closed on
May 18, 2004
Sold by
Nevin Andrew P and Nevin Susan A
Bought by
Pries Donna
Current Estimated Value
Home Financials for this Owner
Home Financials are based on the most recent Mortgage that was taken out on this home.
Original Mortgage
$160,000
Outstanding Balance
$77,646
Interest Rate
6%
Mortgage Type
Unknown
Estimated Equity
$207,990
Purchase Details
Closed on
Jun 19, 1998
Sold by
Sommer Richard P
Bought by
Nevin Andrew P and Seguin Susan A
Home Financials for this Owner
Home Financials are based on the most recent Mortgage that was taken out on this home.
Original Mortgage
$114,000
Interest Rate
7.27%
Purchase Details
Closed on
Aug 30, 1993
Sold by
Beverly Trust Company
Bought by
Sommer Richard P
Home Financials for this Owner
Home Financials are based on the most recent Mortgage that was taken out on this home.
Original Mortgage
$75,000
Interest Rate
7.28%
Create a Home Valuation Report for This Property
The Home Valuation Report is an in-depth analysis detailing your home's value as well as a comparison with similar homes in the area
Home Values in the Area
Average Home Value in this Area
Purchase History
| Date | Buyer | Sale Price | Title Company |
|---|---|---|---|
| Pries Donna | $178,000 | Atgf Inc | |
| Nevin Andrew P | $120,000 | Ticor Title | |
| Sommer Richard P | -- | -- |
Source: Public Records
Mortgage History
| Date | Status | Borrower | Loan Amount |
|---|---|---|---|
| Open | Pries Donna | $160,000 | |
| Previous Owner | Nevin Andrew P | $114,000 | |
| Previous Owner | Sommer Richard P | $75,000 |
Source: Public Records
Tax History Compared to Growth
Tax History
| Year | Tax Paid | Tax Assessment Tax Assessment Total Assessment is a certain percentage of the fair market value that is determined by local assessors to be the total taxable value of land and additions on the property. | Land | Improvement |
|---|---|---|---|---|
| 2024 | $5,694 | $20,000 | $4,241 | $15,759 |
| 2023 | $4,986 | $20,000 | $4,241 | $15,759 |
| 2022 | $4,986 | $16,019 | $3,635 | $12,384 |
| 2021 | $4,851 | $16,018 | $3,634 | $12,384 |
| 2020 | $4,754 | $16,018 | $3,634 | $12,384 |
| 2019 | $4,961 | $16,204 | $3,331 | $12,873 |
| 2018 | $4,860 | $16,204 | $3,331 | $12,873 |
| 2017 | $4,802 | $16,204 | $3,331 | $12,873 |
| 2016 | $4,151 | $12,983 | $2,726 | $10,257 |
| 2015 | $4,110 | $12,983 | $2,726 | $10,257 |
| 2014 | $4,032 | $12,983 | $2,726 | $10,257 |
| 2013 | $4,830 | $16,151 | $2,726 | $13,425 |
Source: Public Records
Map
Nearby Homes
- 10026 S Spaulding Ave
- 9953 S Sawyer Ave
- 3132 W 101st Place
- 10240 S Whipple St
- The Cherry Plan at Steeple Bend
- The Birch Plan at Steeple Bend
- The Ash Plan at Steeple Bend
- The Dogwood Plan at Steeple Bend
- 3534 W 103rd St
- 10324 S Sacramento Ave
- 2918 W 99th Place
- 10455 S Spaulding Ave
- 9656 S Utica Ave
- 10416 S Sacramento Ave
- 2820 W 100th Place
- 9813 S Lawndale Ave
- 9602 S Troy Ave
- 3435 W 105th Place
- 9906 S California Ave
- 9546 S Spaulding Ave
- 10051 S Spaulding Ave
- 10049 S Spaulding Ave
- 10101 S Spaulding Ave
- 3250 W 101st St
- 10054 S Sawyer Ave
- 10033 S Spaulding Ave
- 10048 S Sawyer Ave
- 10105 S Spaulding Ave
- 10042 S Sawyer Ave
- 10029 S Spaulding Ave
- 10109 S Spaulding Ave
- 10058 S Spaulding Ave
- 10054 S Spaulding Ave
- 10038 S Sawyer Ave
- 10042 S Spaulding Ave
- 10025 S Spaulding Ave
- 10100 S Spaulding Ave
- 10115 S Spaulding Ave
- 10034 S Sawyer Ave
- 10038 S Spaulding Ave