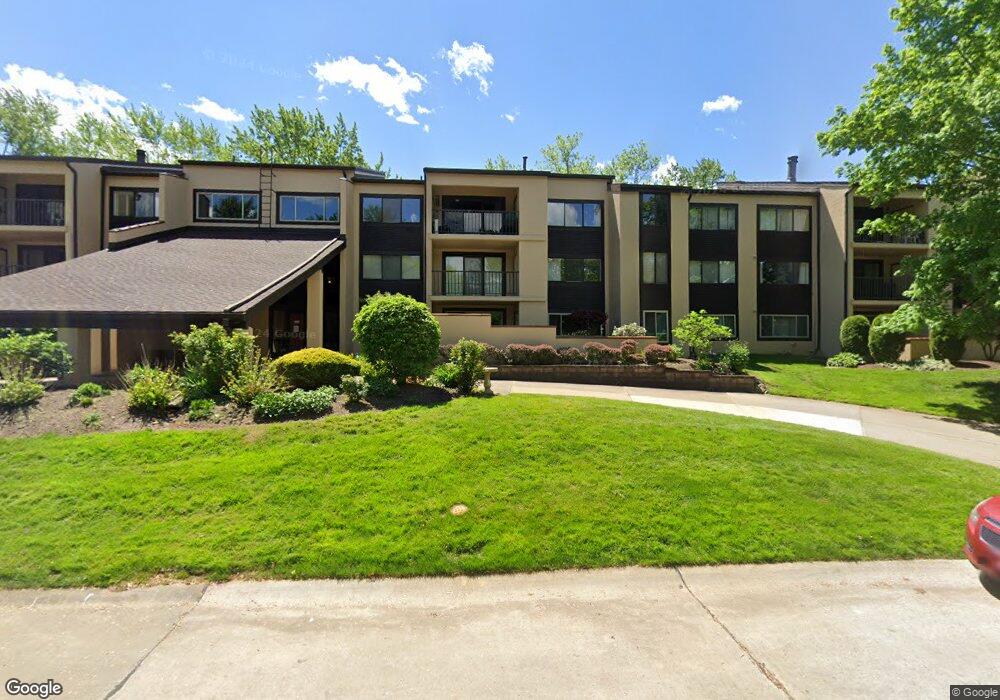
1006 Bunker Dr Fairlawn, OH 44333
Estimated Value: $195,000 - $214,628
2
Beds
2
Baths
2,166
Sq Ft
$95/Sq Ft
Est. Value
About This Home
This home is located at 1006 Bunker Dr, Fairlawn, OH 44333 and is currently estimated at $205,657, approximately $94 per square foot. 1006 Bunker Dr is a home located in Summit County with nearby schools including Copley-Fairlawn Middle School, Copley High School, and Fairlawn Lutheran School.
Ownership History
Date
Name
Owned For
Owner Type
Purchase Details
Closed on
Jul 1, 2014
Sold by
Third Federal Savings And Loan Assn
Bought by
Mitchell Eugene Joseph
Current Estimated Value
Home Financials for this Owner
Home Financials are based on the most recent Mortgage that was taken out on this home.
Original Mortgage
$82,854
Outstanding Balance
$63,015
Interest Rate
4.12%
Mortgage Type
New Conventional
Estimated Equity
$142,642
Purchase Details
Closed on
Oct 7, 2013
Sold by
Steller Roger A
Bought by
Third Federal Savings And Loan Assn Oc C
Purchase Details
Closed on
Mar 25, 2006
Sold by
Steller Roger A
Bought by
Steller Roger A and Susan W Steller Revocable Trust
Purchase Details
Closed on
Jun 22, 1995
Sold by
Steller Roger L and Steller Susan W
Bought by
Steller Susan W and Susan W Steller Revocable Trust
Create a Home Valuation Report for This Property
The Home Valuation Report is an in-depth analysis detailing your home's value as well as a comparison with similar homes in the area
Home Values in the Area
Average Home Value in this Area
Purchase History
| Date | Buyer | Sale Price | Title Company |
|---|---|---|---|
| Mitchell Eugene Joseph | $90,000 | None Available | |
| Third Federal Savings And Loan Assn Oc C | $72,000 | None Available | |
| Steller Roger A | -- | None Available | |
| Steller Susan W | -- | -- |
Source: Public Records
Mortgage History
| Date | Status | Borrower | Loan Amount |
|---|---|---|---|
| Open | Mitchell Eugene Joseph | $82,854 |
Source: Public Records
Tax History Compared to Growth
Tax History
| Year | Tax Paid | Tax Assessment Tax Assessment Total Assessment is a certain percentage of the fair market value that is determined by local assessors to be the total taxable value of land and additions on the property. | Land | Improvement |
|---|---|---|---|---|
| 2025 | $2,570 | $61,453 | $5,782 | $55,671 |
| 2024 | $2,448 | $61,453 | $5,782 | $55,671 |
| 2023 | $2,570 | $61,453 | $5,782 | $55,671 |
| 2022 | $2,614 | $54,383 | $5,117 | $49,266 |
| 2021 | $2,456 | $54,383 | $5,117 | $49,266 |
| 2020 | $2,401 | $54,390 | $5,120 | $49,270 |
| 2019 | $2,099 | $42,460 | $4,860 | $37,600 |
| 2018 | $2,057 | $42,460 | $4,860 | $37,600 |
| 2017 | $1,875 | $42,460 | $4,860 | $37,600 |
| 2016 | $1,873 | $36,200 | $4,860 | $31,340 |
| 2015 | $1,875 | $36,200 | $4,860 | $31,340 |
| 2014 | $1,868 | $36,200 | $4,860 | $31,340 |
| 2013 | $1,956 | $38,040 | $4,860 | $33,180 |
Source: Public Records
Map
Nearby Homes
- 1012 Bunker Dr Unit 304
- 3404 S Smith Rd
- 3354 Bancroft Rd
- 278 Chestnut Ln
- 3340 Willow Ln
- 360 Marviel Dr
- 3475 Bancroft Rd
- 242 Elm Ln
- 3430 Links Dr
- 3451 Stanley Rd
- 3143 Morewood Rd
- 3317 Morewood Rd
- 462 Gresham Dr
- 482 Gresham Dr
- 3571 Bay Hill Dr
- 3584 Bay Hill Dr
- 3683 Preserve Ct
- 3694 Preserve Ct
- 3703 Overlook Ct
- FINLEY Plan at Rosemont - Rosemont Retreat
- 1006 Bunker Dr
- 1006 Bunker Dr
- 1006 Bunker Dr
- 1006 Bunker Dr
- 1006 Bunker Dr
- 1006 Bunker Dr Unit 105
- 1006 Bunker Dr
- 1006 Bunker Dr
- 1006 Bunker Dr Unit 304
- 1006 Bunker Dr
- 1006 Bunker Dr
- 1006 Bunker Dr
- 1006 Bunker Dr
- 1006 Bunker Dr
- 1006 Bunker Dr
- 1006 Bunker Dr
- 1006 Bunker Dr
- 1006 Bunker Dr Unit 300
- 1006 Bunker Dr
- 1006 Bunker Dr