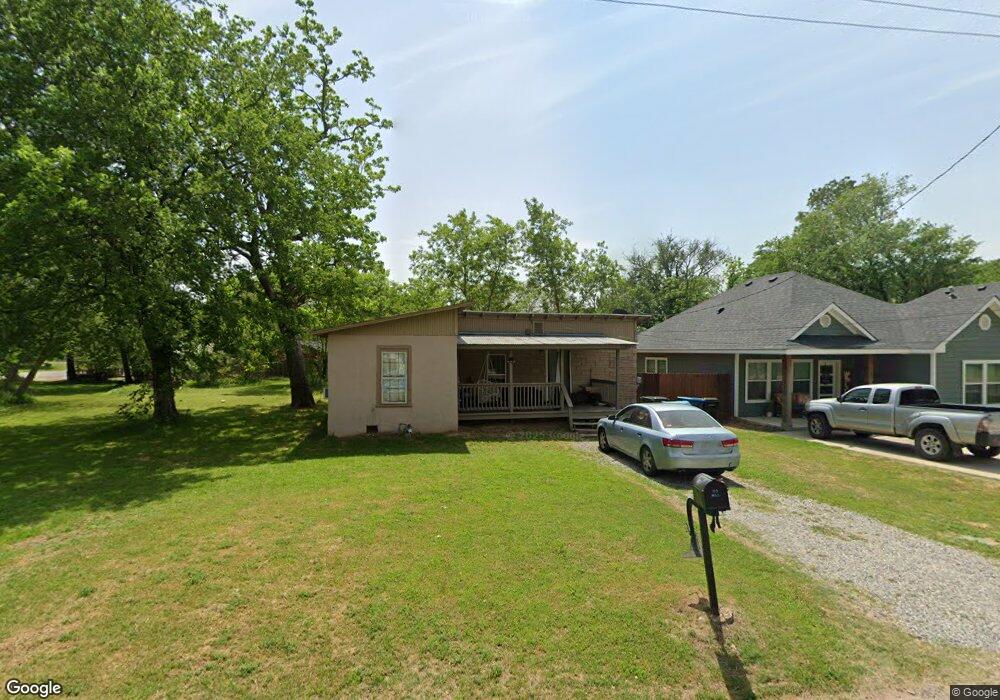
1006 Chase St Denison, TX 75020
Estimated Value: $98,000 - $124,000
2
Beds
1
Bath
823
Sq Ft
$135/Sq Ft
Est. Value
About This Home
This home is located at 1006 Chase St, Denison, TX 75020 and is currently estimated at $111,000, approximately $134 per square foot. 1006 Chase St is a home located in Grayson County with nearby schools including Scott Middle School, Denison High School, and St. Luke's Parish Day School.
Ownership History
Date
Name
Owned For
Owner Type
Purchase Details
Closed on
Jun 18, 2021
Sold by
The House Of All Possibilities Llc
Bought by
Savoy Development & Acquisitions Llc
Current Estimated Value
Purchase Details
Closed on
Jun 5, 2020
Sold by
Consultobiz Inc
Bought by
House Of All Possibilities Llc
Purchase Details
Closed on
Jun 12, 2018
Sold by
City Of Denison
Bought by
Consultobiz Inc
Purchase Details
Closed on
Jun 7, 2018
Sold by
Grayson County Criminal District Attorne
Bought by
The City Of Denison
Purchase Details
Closed on
May 13, 2011
Sold by
Stafford Edna Faye
Bought by
Stafford Robert W
Purchase Details
Closed on
Apr 9, 2009
Sold by
Stafford Robert W
Bought by
Stafford Edna Faye
Purchase Details
Closed on
Jan 23, 2007
Sold by
Stafford Edna Faye
Bought by
Stafford Robert W
Create a Home Valuation Report for This Property
The Home Valuation Report is an in-depth analysis detailing your home's value as well as a comparison with similar homes in the area
Home Values in the Area
Average Home Value in this Area
Purchase History
| Date | Buyer | Sale Price | Title Company |
|---|---|---|---|
| Savoy Development & Acquisitions Llc | -- | Fidelity National Title | |
| House Of All Possibilities Llc | -- | None Available | |
| Consultobiz Inc | -- | Grayson County Title | |
| The City Of Denison | -- | Grayson County Title | |
| Stafford Robert W | -- | None Available | |
| Stafford Edna Faye | -- | None Available | |
| Stafford Robert W | -- | None Available |
Source: Public Records
Tax History
| Year | Tax Paid | Tax Assessment Tax Assessment Total Assessment is a certain percentage of the fair market value that is determined by local assessors to be the total taxable value of land and additions on the property. | Land | Improvement |
|---|---|---|---|---|
| 2025 | $2,045 | $88,003 | $36,670 | $51,333 |
| 2024 | $2,045 | $88,003 | $36,670 | $51,333 |
| 2023 | $1,848 | $81,588 | $33,881 | $47,707 |
| 2022 | $1,871 | $78,730 | $35,293 | $43,437 |
| 2021 | $1,248 | $49,482 | $13,120 | $36,362 |
| 2020 | $1,134 | $42,975 | $9,840 | $33,135 |
| 2019 | $1,200 | $43,620 | $9,840 | $33,780 |
| 2018 | $784 | $41,562 | $5,904 | $35,658 |
| 2017 | $718 | $35,912 | $3,280 | $32,632 |
| 2016 | $1,151 | $31,947 | $3,280 | $28,667 |
Source: Public Records
Map
Nearby Homes
- 928 W Chase St
- 933 Rice St
- 1020 Rice St
- 929 W Collins St
- 1901 Woodlawn Blvd
- 736 W Bullock St
- 732 W Bullock St
- 916 W Collins St
- 2560 S Scullin Ave
- 1830 Clark Dr
- 1500 S Scullin Ave
- 217 W Acheson St
- 528 W Florence St
- 709 W Hanna St
- 614 Rice St
- 0 S Maurice Ave
- 603 W Star St
- 516 W Florence St
- 513 W Coffin St
- 508 W Florence St
Your Personal Tour Guide
Ask me questions while you tour the home.