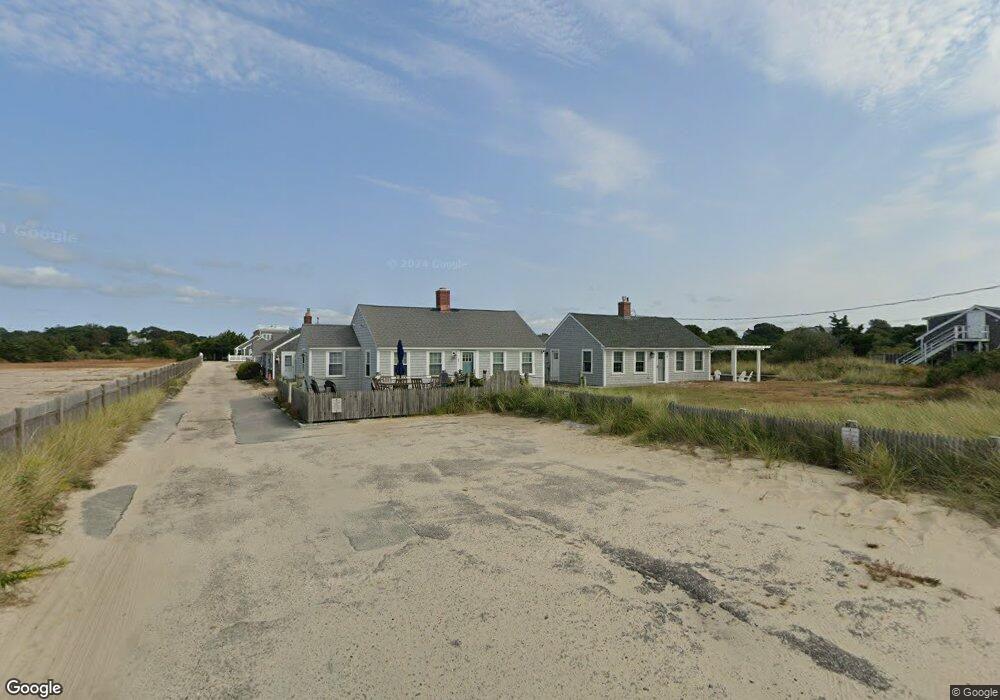
1006 Craigville Bch Rd Unit 2 Centerville, MA 02632
Centerville NeighborhoodEstimated Value: $448,000 - $497,000
1
Bed
1
Bath
557
Sq Ft
$845/Sq Ft
Est. Value
About This Home
This home is located at 1006 Craigville Bch Rd Unit 2, Centerville, MA 02632 and is currently estimated at $470,589, approximately $844 per square foot. 1006 Craigville Bch Rd Unit 2 is a home located in Barnstable County with nearby schools including Centerville Elementary School, Barnstable United Elementary School, and Barnstable Intermediate School.
Ownership History
Date
Name
Owned For
Owner Type
Purchase Details
Closed on
Sep 13, 2020
Sold by
Williams Bruce C and Williams Kimberly K
Bought by
Lyons Nelly
Current Estimated Value
Home Financials for this Owner
Home Financials are based on the most recent Mortgage that was taken out on this home.
Original Mortgage
$130,000
Outstanding Balance
$114,841
Interest Rate
2.9%
Mortgage Type
New Conventional
Estimated Equity
$355,748
Purchase Details
Closed on
Oct 11, 2006
Sold by
Arcese Jane A
Bought by
Balacco Courtney Jo and Arcese Jane A
Purchase Details
Closed on
Oct 11, 2002
Sold by
Int Janus and Grady Kenneth A
Bought by
Arcese James A
Home Financials for this Owner
Home Financials are based on the most recent Mortgage that was taken out on this home.
Original Mortgage
$95,000
Interest Rate
6.24%
Mortgage Type
Purchase Money Mortgage
Create a Home Valuation Report for This Property
The Home Valuation Report is an in-depth analysis detailing your home's value as well as a comparison with similar homes in the area
Home Values in the Area
Average Home Value in this Area
Purchase History
| Date | Buyer | Sale Price | Title Company |
|---|---|---|---|
| Lyons Nelly | $204,000 | None Available | |
| Balacco Courtney Jo | -- | -- | |
| Balacco Courtney Jo | -- | -- | |
| Arcese James A | $187,500 | -- |
Source: Public Records
Mortgage History
| Date | Status | Borrower | Loan Amount |
|---|---|---|---|
| Open | Lyons Nelly | $130,000 | |
| Previous Owner | Arcese James A | $95,000 |
Source: Public Records
Tax History Compared to Growth
Tax History
| Year | Tax Paid | Tax Assessment Tax Assessment Total Assessment is a certain percentage of the fair market value that is determined by local assessors to be the total taxable value of land and additions on the property. | Land | Improvement |
|---|---|---|---|---|
| 2025 | $3,696 | $456,800 | $0 | $456,800 |
| 2024 | $3,338 | $427,400 | $0 | $427,400 |
| 2023 | $2,940 | $352,500 | $0 | $352,500 |
| 2022 | $1,877 | $194,700 | $0 | $194,700 |
| 2021 | $2,357 | $224,700 | $0 | $224,700 |
| 2020 | $2,267 | $206,800 | $0 | $206,800 |
| 2019 | $2,367 | $209,800 | $0 | $209,800 |
| 2018 | $2,213 | $201,700 | $0 | $201,700 |
| 2017 | $2,169 | $201,600 | $0 | $201,600 |
| 2016 | $2,197 | $201,600 | $0 | $201,600 |
| 2015 | $2,094 | $193,000 | $0 | $193,000 |
Source: Public Records
Map
Nearby Homes
- 1060 Craigville Beach Rd
- 498 Elliott Rd
- 35 Valley Ave
- 50 Pheasant Way Unit A&B
- 50 Pheasant Way
- 436 S Main St
- 627 S Main St
- 627 S Main St
- 142 Greely Ave
- 359 Lake Elizabeth Dr
- 156 S Main St
- 290 Riverview Ln
- 41 Pinecrest Rd
- 818 S Main St
- 200 6th Ave
- 260 Tobey Way
- 52 Meadow Farm Rd
- 22 Keel Way
- 53 Meadow Farm Rd
- 1006 Craigville Bch Rd Unit 8
- 1006 Craigville Bch Rd Unit 7
- 1006 Craigville Bch Rd Unit 6
- 1006 Craigville Bch Rd Unit 5
- 1006 Craigville Bch Rd Unit 4
- 1006 Craigville Bch Rd Unit 3
- 1006 Craigville Bch Rd Unit 1
- 1006 Craigville Bch Rd Unit 6&7
- 1006 Craigville Bch Rd
- 1006 Craigville Bch Rd Unit 2B
- 1006 Craigville Beach Rd Unit 6&7
- 1006 Craigville Beach Rd Unit 6F
- 1006 Craigville Beach Rd Unit 7G
- 1006 Craigville Beach Rd
- 1006 Craigville Beach Rd Unit 1
- 1006 Craigville Beach Rd Unit 5
- 1006 Craigville Beach Rd Unit 8
- 1006 Craigville Beach Rd Unit 2
- 1006 Craigville Beach Rd Unit 3
- 1006 Craigville Beach Rd Unit 7