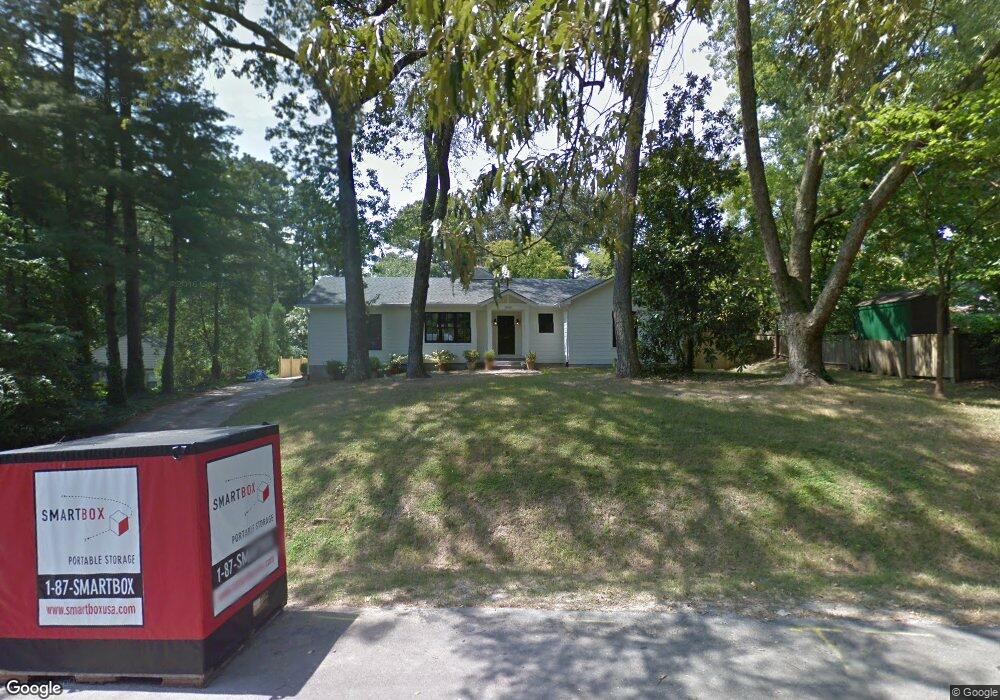
1006 Francisco Rd Henrico, VA 23229
Estimated Value: $847,000 - $983,000
3
Beds
3
Baths
1,378
Sq Ft
$679/Sq Ft
Est. Value
About This Home
This home is located at 1006 Francisco Rd, Henrico, VA 23229 and is currently estimated at $936,042, approximately $679 per square foot. 1006 Francisco Rd is a home located in Henrico County with nearby schools including Tuckahoe Elementary School, Tuckahoe Middle School, and Douglas S. Freeman High School.
Ownership History
Date
Name
Owned For
Owner Type
Purchase Details
Closed on
Jun 9, 2014
Sold by
Dha Investments Llc
Bought by
Connor Iii Robert E O
Current Estimated Value
Home Financials for this Owner
Home Financials are based on the most recent Mortgage that was taken out on this home.
Original Mortgage
$510,840
Outstanding Balance
$388,702
Interest Rate
4.21%
Mortgage Type
New Conventional
Estimated Equity
$547,340
Purchase Details
Closed on
Aug 27, 2013
Sold by
White Sub Tr Samuel I and Pilcher Robert M
Bought by
Dha Investments Llc
Purchase Details
Closed on
Oct 3, 1997
Sold by
Ebel T Ebel C and Ebel C
Bought by
Pilcher Robert M and Pilcher Pamela M
Home Financials for this Owner
Home Financials are based on the most recent Mortgage that was taken out on this home.
Original Mortgage
$140,000
Interest Rate
7.41%
Mortgage Type
New Conventional
Create a Home Valuation Report for This Property
The Home Valuation Report is an in-depth analysis detailing your home's value as well as a comparison with similar homes in the area
Home Values in the Area
Average Home Value in this Area
Purchase History
| Date | Buyer | Sale Price | Title Company |
|---|---|---|---|
| Connor Iii Robert E O | $239,000 | -- | |
| Dha Investments Llc | $193,947 | -- | |
| Pilcher Robert M | $135,000 | -- |
Source: Public Records
Mortgage History
| Date | Status | Borrower | Loan Amount |
|---|---|---|---|
| Open | Connor Iii Robert E O | $510,840 | |
| Previous Owner | Pilcher Robert M | $140,000 |
Source: Public Records
Tax History Compared to Growth
Tax History
| Year | Tax Paid | Tax Assessment Tax Assessment Total Assessment is a certain percentage of the fair market value that is determined by local assessors to be the total taxable value of land and additions on the property. | Land | Improvement |
|---|---|---|---|---|
| 2025 | $7,184 | $763,400 | $175,000 | $588,400 |
| 2024 | $7,184 | $730,100 | $165,000 | $565,100 |
| 2023 | $6,206 | $730,100 | $165,000 | $565,100 |
| 2022 | $5,097 | $599,600 | $140,000 | $459,600 |
| 2021 | $4,891 | $544,900 | $115,000 | $429,900 |
| 2020 | $4,741 | $544,900 | $115,000 | $429,900 |
| 2019 | $4,565 | $524,700 | $100,000 | $424,700 |
| 2018 | $4,565 | $524,700 | $100,000 | $424,700 |
| 2017 | $4,173 | $479,700 | $95,000 | $384,700 |
| 2016 | $3,877 | $445,600 | $82,500 | $363,100 |
| 2015 | $2,407 | $282,100 | $82,500 | $199,600 |
| 2014 | $2,407 | $276,700 | $78,500 | $198,200 |
Source: Public Records
Map
Nearby Homes
- 7724 Sweetbriar Rd
- 8009 Patterson Ave
- 1019 Baldwin Rd
- 7708 Brookside Rd
- 1311 Beverly Dr
- 1100 Skipwith Rd
- 7311 Durwood Crescent
- 8300 Ridge Rd
- 7508 Westfield Rd
- 1011 Ridge Top Rd
- 8416 Ridge Rd
- 1121 Bridle Ln
- 0 Ridge Rd
- 7015 Chandler Dr
- 8506 Three Chopt Rd
- 300 N Ridge Rd Unit 45
- 1516 Westbury Dr
- 7303 Parkline Dr
- 8001 University Dr
- 1613 Westhill Rd
- 1004 Francisco Rd
- 1002 Francisco Rd
- 1005 Forest Ave
- 1008 Francisco Rd
- 1003 Forest Ave
- 1000 Francisco Rd
- 1013 Francisco Rd
- 1015 Francisco Rd
- 1009 Francisco Rd
- 1001 Forest Ave
- 1011 Francisco Rd
- 1017 Francisco Rd
- 1005 Francisco Rd
- 7912 Stuart Hall Rd
- 7910 Stuart Hall Rd
- 1007 Francisco Rd
- 1019 Francisco Rd
- 1003 Francisco Rd
- 7908 Stuart Hall Rd
- 1001 Francisco Rd