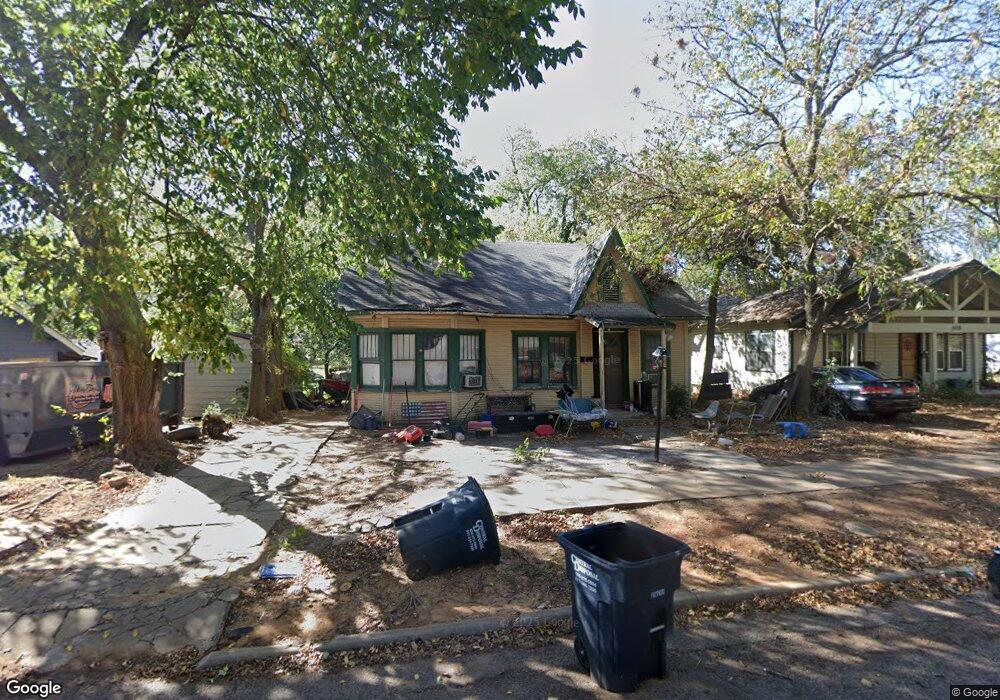
1006 Hobson St Shawnee, OK 74801
Estimated Value: $65,945 - $114,000
3
Beds
2
Baths
1,167
Sq Ft
$69/Sq Ft
Est. Value
About This Home
This home is located at 1006 Hobson St, Shawnee, OK 74801 and is currently estimated at $80,736, approximately $69 per square foot. 1006 Hobson St is a home located in Pottawatomie County with nearby schools including Sequoyah Elementary School, Shawnee Middle School, and Shawnee High School.
Ownership History
Date
Name
Owned For
Owner Type
Purchase Details
Closed on
Nov 25, 2015
Sold by
Shropshire Gale A and Shropshire Kathy
Bought by
Shropshire Colin P
Current Estimated Value
Purchase Details
Closed on
Feb 17, 2012
Sold by
Shropshire Kathy R and Shrophshire Gale A
Bought by
Realan Properties Llc
Purchase Details
Closed on
Jan 12, 2012
Sold by
Federal National Mortgage Association
Bought by
Shropshire Kathy R and Shropshire Gale A
Purchase Details
Closed on
Jul 27, 2011
Sold by
Flatt Kyle G
Bought by
Federal National Mortgage Association
Purchase Details
Closed on
Feb 27, 2004
Sold by
Childers Danny
Bought by
Flatt Kyle G
Purchase Details
Closed on
Sep 29, 1999
Sold by
Raney Clarence and Raney Mae
Bought by
Wingfield Teresa
Purchase Details
Closed on
Sep 10, 1991
Sold by
Taron Laurel
Bought by
Raney Mae and Raney Clarence
Create a Home Valuation Report for This Property
The Home Valuation Report is an in-depth analysis detailing your home's value as well as a comparison with similar homes in the area
Purchase History
| Date | Buyer | Sale Price | Title Company |
|---|---|---|---|
| Shropshire Colin P | $24,666 | Choice Title Insurance | |
| Realan Properties Llc | -- | None Available | |
| Realan Properties Llc | -- | None Available | |
| Shropshire Kathy R | -- | Multiple | |
| Federal National Mortgage Association | $46,912 | None Available | |
| Flatt Kyle G | $57,500 | -- | |
| Wingfield Teresa | $42,500 | -- | |
| Raney Mae | -- | -- |
Source: Public Records
Tax History
| Year | Tax Paid | Tax Assessment Tax Assessment Total Assessment is a certain percentage of the fair market value that is determined by local assessors to be the total taxable value of land and additions on the property. | Land | Improvement |
|---|---|---|---|---|
| 2025 | $324 | $3,306 | $1,200 | $2,106 |
| 2024 | $313 | $3,148 | $1,200 | $1,948 |
| 2023 | $313 | $2,999 | $1,200 | $1,799 |
| 2022 | $308 | $2,999 | $1,200 | $1,799 |
| 2021 | $456 | $4,528 | $1,200 | $3,328 |
| 2020 | $458 | $4,528 | $1,200 | $3,328 |
| 2019 | $473 | $4,528 | $1,200 | $3,328 |
| 2018 | $455 | $4,445 | $1,200 | $3,245 |
| 2017 | $449 | $4,445 | $1,200 | $3,245 |
| 2016 | $449 | $4,404 | $1,200 | $3,204 |
| 2015 | $541 | $5,404 | $1,200 | $4,204 |
| 2014 | $563 | $5,625 | $1,200 | $4,425 |
Source: Public Records
Map
Nearby Homes
- 1102 N Park Ave
- 1207 N Beard Ave
- 824 N Union Ave
- 1309 N Broadway Ave
- 434 E Wallace St
- 204 W Wallace St
- 819 N Park Ave
- 709 N Broadway Ave
- 1108 N Pennsylvania Ave
- 641 N Broadway Ave
- 1510 N Union Ave
- 1432 N Park Ave
- 0 Independence and Minnesota St
- 1617 N Beard St
- 731 N Kickapoo Ave
- 1505 N Louisa Ave
- 1002 Jefferson Place
- 545 W Poplar St
- 706 N Louisa Ave
- 307 N Louisa Ave
- 1028 N Hobson Ave
- 1028 N Hobson Ave
- 1008 Hobson St
- 1006 N Hobson Ave
- 18 E Burns St
- 1008 N Hobson Ave
- 22 E Burns St
- 1012 N Hobson Ave
- 16 E Burns St
- 1026 Hobson St
- 1001 Hobson St
- 1009 N Bdwy
- 1007 N Bdwy
- 1011 Hobson St
- 1015 N Bdwy Ave
- 1001 N Hobson Ave
- 1027 Hobson St
- 1001 N Bdwy Ave
- 9 E Burns St
- 1030 Hobson St
Your Personal Tour Guide
Ask me questions while you tour the home.