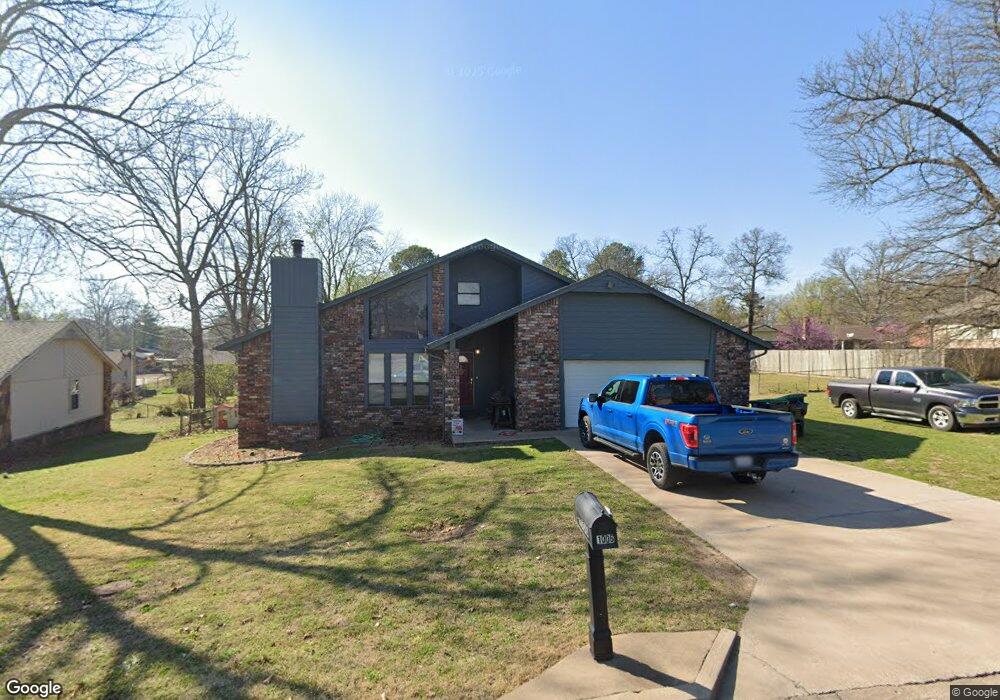
1006 Kaufman Ave Tahlequah, OK 74464
Estimated Value: $274,029 - $299,000
4
Beds
3
Baths
2,248
Sq Ft
$128/Sq Ft
Est. Value
About This Home
This home is located at 1006 Kaufman Ave, Tahlequah, OK 74464 and is currently estimated at $287,507, approximately $127 per square foot. 1006 Kaufman Ave is a home located in Cherokee County with nearby schools including Greenwood Elementary School, Cherokee Elementary School, and Tahlequah Middle School.
Ownership History
Date
Name
Owned For
Owner Type
Purchase Details
Closed on
Dec 30, 2021
Sold by
Ann Abel and Ann Heather
Bought by
Snow Madyson B and Snow Joseph M
Current Estimated Value
Home Financials for this Owner
Home Financials are based on the most recent Mortgage that was taken out on this home.
Original Mortgage
$209,000
Interest Rate
3.05%
Mortgage Type
New Conventional
Purchase Details
Closed on
Oct 19, 2021
Sold by
Copley Rodney J
Bought by
Abel Cb and Abel Heather Ann
Home Financials for this Owner
Home Financials are based on the most recent Mortgage that was taken out on this home.
Original Mortgage
$77,894
Interest Rate
2.8%
Mortgage Type
Stand Alone Second
Purchase Details
Closed on
Jul 25, 1997
Sold by
Carlyle Ingle
Bought by
Rodney Copley
Purchase Details
Closed on
Nov 12, 1993
Sold by
Yandell David W and Yandell Lori A
Bought by
Eva Carlyle B and Eva Ingle
Create a Home Valuation Report for This Property
The Home Valuation Report is an in-depth analysis detailing your home's value as well as a comparison with similar homes in the area
Home Values in the Area
Average Home Value in this Area
Purchase History
| Date | Buyer | Sale Price | Title Company |
|---|---|---|---|
| Snow Madyson B | -- | New Title Company Name | |
| Abel Cb | $75,000 | Green Country Abstract & Ttl | |
| Rodney Copley | $88,000 | -- | |
| Eva Carlyle B | $89,900 | -- |
Source: Public Records
Mortgage History
| Date | Status | Borrower | Loan Amount |
|---|---|---|---|
| Closed | Snow Madyson B | $209,000 | |
| Previous Owner | Abel Cb | $77,894 |
Source: Public Records
Tax History Compared to Growth
Tax History
| Year | Tax Paid | Tax Assessment Tax Assessment Total Assessment is a certain percentage of the fair market value that is determined by local assessors to be the total taxable value of land and additions on the property. | Land | Improvement |
|---|---|---|---|---|
| 2025 | $2,364 | $26,724 | $1,650 | $25,074 |
| 2024 | $2,364 | $25,946 | $1,650 | $24,296 |
| 2023 | $2,364 | $25,190 | $1,935 | $23,255 |
| 2022 | $2,244 | $25,190 | $1,935 | $23,255 |
| 2021 | $1,140 | $13,243 | $3,106 | $10,137 |
| 2020 | $1,124 | $12,857 | $3,016 | $9,841 |
| 2019 | $1,079 | $12,482 | $2,928 | $9,554 |
| 2018 | $1,057 | $12,119 | $1,112 | $11,007 |
| 2017 | $1,022 | $11,766 | $1,080 | $10,686 |
| 2016 | $995 | $11,423 | $876 | $10,547 |
| 2015 | $919 | $11,092 | $1,028 | $10,064 |
| 2014 | $919 | $10,768 | $770 | $9,998 |
Source: Public Records
Map
Nearby Homes
- 1005 Kaufman Ave
- 720 S East Ave
- 1105 S Maple Ave
- 835 Blue Heron
- 952 Edgewater
- 1041 Edgewater
- 1065 Edgewater
- 725 Sooner Dr
- 413 Greenwood Dr
- 605 S Oak Ave
- 508 Covington Place
- 702 Wilson Ave
- 857 Crestview
- 848 Crestview
- 201 Sandy Cir
- 306 Short St
- 104 Tommye Ln
- 932 Rosemary
- 757 S Bluff Ave
- 14351 U S Highway 62
- 1008 Kaufman Ave
- 1004 S Kaufman Dr
- 1004 Kaufman Ave
- 1007 S East Ave
- 1009 S East Ave
- 1011 S East Ave
- 1010 Kaufman Ave
- 1002 Kaufman Ave
- 1003 Kaufman Ave
- 1101 S East Ave
- 1001 S East Ave
- 1001 Kaufman Ave
- 1012 Kaufman Ave
- 1009 Kaufman Ave
- 24138 S 508 Rd
- 681 Bois Darc
- 691 Bois Darc
- 690 Bois Darc
- 22790 Sunrise Ridge Dr