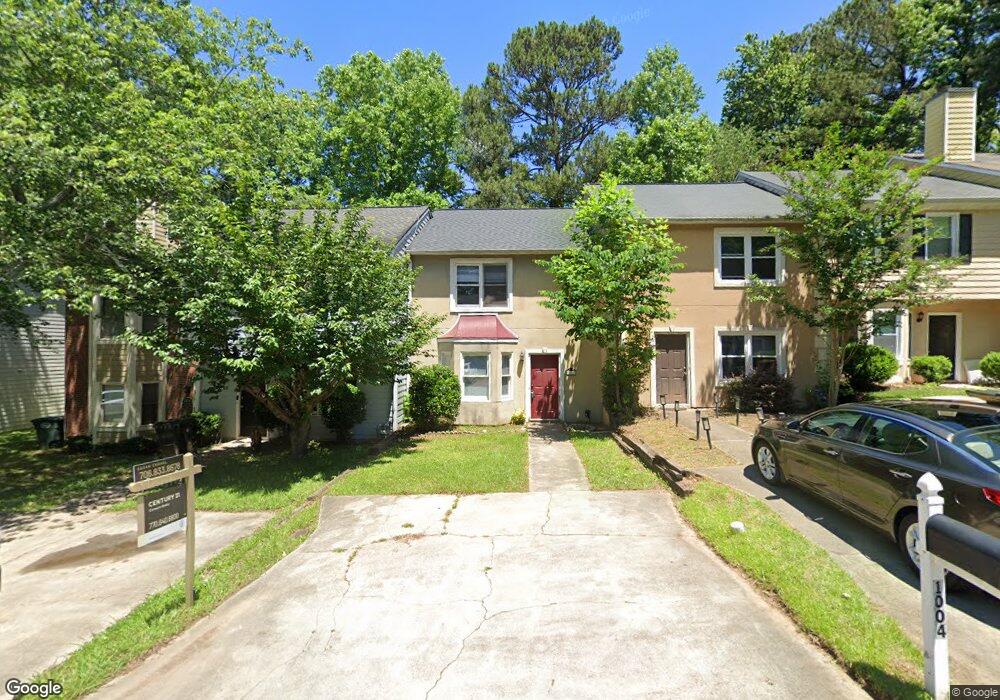
1006 Kennesborough Rd NW Kennesaw, GA 30144
Estimated Value: $204,000 - $260,000
2
Beds
3
Baths
1,252
Sq Ft
$178/Sq Ft
Est. Value
About This Home
This home is located at 1006 Kennesborough Rd NW, Kennesaw, GA 30144 and is currently estimated at $223,290, approximately $178 per square foot. 1006 Kennesborough Rd NW is a home located in Cobb County with nearby schools including Kennesaw Elementary School, Big Shanty Elementary School, and Awtrey Middle School.
Ownership History
Date
Name
Owned For
Owner Type
Purchase Details
Closed on
Oct 14, 2015
Sold by
Roland Leif
Bought by
Roland Leif and Roland Martha Gardner
Current Estimated Value
Purchase Details
Closed on
Jan 25, 2008
Sold by
Jp Morgan Chase Bk Na
Bought by
Roland Leif and Gardner Martha
Purchase Details
Closed on
Dec 4, 2007
Sold by
Strokes Rufus H
Bought by
Jp Morgan Chase Bk
Purchase Details
Closed on
Dec 23, 2005
Sold by
Weiler Jean L
Bought by
Stokes Ruffus H
Home Financials for this Owner
Home Financials are based on the most recent Mortgage that was taken out on this home.
Original Mortgage
$101,600
Interest Rate
6.28%
Mortgage Type
New Conventional
Purchase Details
Closed on
Oct 11, 1993
Sold by
First Union Nbg
Bought by
Weiler Jean L
Home Financials for this Owner
Home Financials are based on the most recent Mortgage that was taken out on this home.
Original Mortgage
$41,600
Interest Rate
6.99%
Create a Home Valuation Report for This Property
The Home Valuation Report is an in-depth analysis detailing your home's value as well as a comparison with similar homes in the area
Home Values in the Area
Average Home Value in this Area
Purchase History
| Date | Buyer | Sale Price | Title Company |
|---|---|---|---|
| Roland Leif | -- | -- | |
| Roland Leif | $75,000 | -- | |
| Jp Morgan Chase Bk | $78,289 | -- | |
| Stokes Ruffus H | $127,000 | -- | |
| Weiler Jean L | $52,000 | -- |
Source: Public Records
Mortgage History
| Date | Status | Borrower | Loan Amount |
|---|---|---|---|
| Previous Owner | Stokes Ruffus H | $101,600 | |
| Previous Owner | Weiler Jean L | $41,600 |
Source: Public Records
Tax History Compared to Growth
Tax History
| Year | Tax Paid | Tax Assessment Tax Assessment Total Assessment is a certain percentage of the fair market value that is determined by local assessors to be the total taxable value of land and additions on the property. | Land | Improvement |
|---|---|---|---|---|
| 2025 | $2,521 | $83,656 | $16,000 | $67,656 |
| 2024 | $2,522 | $83,656 | $16,000 | $67,656 |
| 2023 | $1,809 | $60,012 | $16,000 | $44,012 |
| 2022 | $1,821 | $60,012 | $16,000 | $44,012 |
| 2021 | $1,477 | $48,680 | $10,000 | $38,680 |
| 2020 | $1,477 | $48,680 | $10,000 | $38,680 |
| 2019 | $1,477 | $48,680 | $10,000 | $38,680 |
| 2018 | $1,211 | $39,908 | $10,000 | $29,908 |
| 2017 | $1,147 | $39,908 | $10,000 | $29,908 |
| 2016 | $855 | $29,748 | $6,000 | $23,748 |
| 2015 | $670 | $22,732 | $6,000 | $16,732 |
| 2014 | $675 | $22,732 | $0 | $0 |
Source: Public Records
Map
Nearby Homes
- 1001 Hillsborough Chase NW
- 2984 Porsche Place NW
- 2776 Saint Charles Ln NW
- 2517 Hedgeway Cir
- 2719 Hedgeway Cir
- 1015 Kennesaw Springs Dr NW
- 2349 Whispering Dr NW
- 1070 Rackley Way NW
- 2930 Dallas St NW
- 2627 Chase Ridge
- 3057 Windover Ln
- 2104 Irvin Ct
- 2106 Irvin Ct
- 2106 Remy Ct
- 2105 Remy Ct
- 3522 Daventry Ln NW
- 2678 Catawba Dr NW
- 1006 Kennesborough Rd NW Unit 1006
- 1008 Kennesborough Rd NW
- 1004 Kennesborough Rd NW
- 1002 Kennesborough Rd NW
- 1002 Kennesborough Rd NW Unit 1002
- 1010 Kennesborough Rd NW
- 1012 Kennesborough Rd NW
- 1012 Kennesborough Rd NW Unit 134
- 1003 Hillsborough Chase NW
- 1000 Kennesborough Rd NW
- 1001 Hillsborough Chase NW
- 1014 Kennesborough Rd NW
- 1005 Hillsborough Chase NW
- 1018 Kennesborough Rd NW
- 1007 Hillsborough Chase NW
- 1011 Kennesborough Rd NW
- 1015 Kennesborough Rd NW
- 1019 Kennesborough Rd NW
- 1020 Kennesborough Rd NW
- 1020 Kennesborough Rd NW Unit 1020