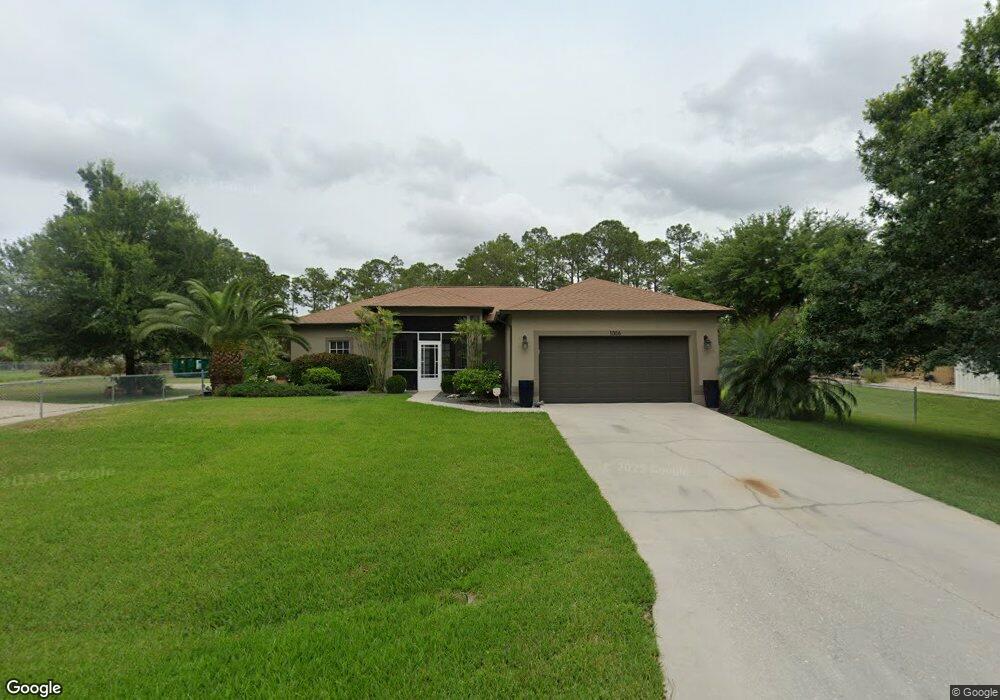
1006 Palmetto Ave Unit 8 Lehigh Acres, FL 33972
Richmond NeighborhoodEstimated Value: $331,327 - $404,000
3
Beds
2
Baths
1,667
Sq Ft
$226/Sq Ft
Est. Value
About This Home
This home is located at 1006 Palmetto Ave Unit 8, Lehigh Acres, FL 33972 and is currently estimated at $377,082, approximately $226 per square foot. 1006 Palmetto Ave Unit 8 is a home located in Lee County with nearby schools including Lehigh Elementary School, The Alva School, and Gateway Elementary School.
Ownership History
Date
Name
Owned For
Owner Type
Purchase Details
Closed on
Aug 31, 2016
Sold by
Martin Herbert Wayne and Martin Marlyn J
Bought by
Short Donna M
Current Estimated Value
Purchase Details
Closed on
Sep 10, 2009
Sold by
Humphrey Richard L and Humphrey Joetta S
Bought by
Martin Herbert and Martin Marilyn
Purchase Details
Closed on
Sep 6, 2005
Sold by
Rd United Group Inc
Bought by
Martin Herbert Wayne and Martin Marilyn J
Home Financials for this Owner
Home Financials are based on the most recent Mortgage that was taken out on this home.
Original Mortgage
$160,720
Interest Rate
6.75%
Mortgage Type
Unknown
Purchase Details
Closed on
Aug 27, 2004
Sold by
Frederickson Calvin A and Frederickson Karole H
Bought by
R D United Group Inc
Create a Home Valuation Report for This Property
The Home Valuation Report is an in-depth analysis detailing your home's value as well as a comparison with similar homes in the area
Home Values in the Area
Average Home Value in this Area
Purchase History
| Date | Buyer | Sale Price | Title Company |
|---|---|---|---|
| Short Donna M | $210,000 | Townsend Title Ins Agency Ll | |
| Martin Herbert | $10,000 | Team Title Ins Agency Inc | |
| Martin Herbert Wayne | $200,900 | -- | |
| R D United Group Inc | $12,000 | Fidelity National Title Ins |
Source: Public Records
Mortgage History
| Date | Status | Borrower | Loan Amount |
|---|---|---|---|
| Previous Owner | Martin Herbert Wayne | $160,720 |
Source: Public Records
Tax History Compared to Growth
Tax History
| Year | Tax Paid | Tax Assessment Tax Assessment Total Assessment is a certain percentage of the fair market value that is determined by local assessors to be the total taxable value of land and additions on the property. | Land | Improvement |
|---|---|---|---|---|
| 2025 | $3,652 | $251,786 | $40,698 | $191,162 |
| 2024 | $3,652 | $267,102 | $32,759 | $208,686 |
| 2023 | $3,683 | $270,911 | $29,706 | $219,214 |
| 2022 | $3,690 | $278,741 | $20,747 | $257,994 |
| 2021 | $2,343 | $196,313 | $13,513 | $182,800 |
| 2020 | $2,349 | $165,869 | $0 | $0 |
| 2019 | $2,326 | $162,140 | $0 | $0 |
| 2018 | $2,290 | $159,117 | $0 | $0 |
| 2017 | $2,257 | $155,844 | $8,820 | $147,024 |
| 2016 | $1,055 | $132,919 | $9,201 | $123,718 |
| 2015 | $1,049 | $112,801 | $8,565 | $104,236 |
| 2014 | $931 | $100,904 | $6,311 | $94,593 |
| 2013 | -- | $61,843 | $5,991 | $55,852 |
Source: Public Records
Map
Nearby Homes
- 900 W 10th St
- 920 Palmetto Ave
- 1014 Magnolia Ave
- 1114 Desoto Ave
- 1610 Desoto Ave
- 913 Desoto Ave
- 1001 11th St W
- 706 W 10th St
- 602 W 10th St
- 505 W 10th St
- 1215 Willard Ave
- 1708 Willard Ave
- 1104 Willard Ave
- 1605 W 11th St
- 901 Williams Ave
- 1518 Williams Ave
- 1902 W 11th St
- 1200 W 11th St
- 1304 Williams Ave
- 902 Williams Ave
- 1006 Palmetto Ave
- 1004 Palmetto Ave
- 1005 Palmetto Ave
- 1012 Palmetto Ave
- 1003 Palmetto Ave
- 900 W 10th St Unit 13
- 1013 Desoto Ave
- 1006 Magnolia Ave
- 803 W 10th St
- 1002 Desoto Ave
- 1010 Desoto Ave
- 904 W 10th St
- 923 Desoto Ave
- 903 W 10th St
- 1017 Desoto Ave
- 1012 Desoto Ave
- 1014 Desoto Ave
- 906 W 10th St
- 905 W 10th St
- 921 Palmetto Ave