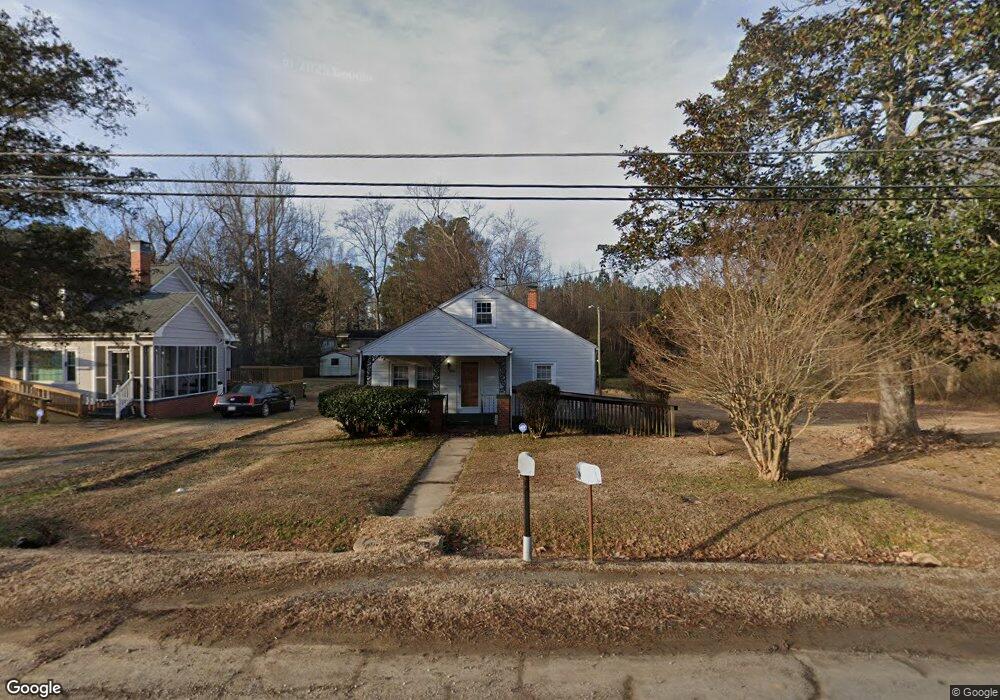
1006 Raleigh St Oxford, NC 27565
Estimated Value: $81,772 - $223,000
--
Bed
1
Bath
1,109
Sq Ft
$151/Sq Ft
Est. Value
About This Home
This home is located at 1006 Raleigh St, Oxford, NC 27565 and is currently estimated at $167,591, approximately $151 per square foot. 1006 Raleigh St is a home located in Granville County with nearby schools including Stovall-Shaw Elementary School, Northern Granville Middle School, and Hill City High School.
Ownership History
Date
Name
Owned For
Owner Type
Purchase Details
Closed on
Sep 2, 2020
Sold by
Norwood Joel
Bought by
Bullock Jacqueline N and Norwood Joel
Current Estimated Value
Purchase Details
Closed on
Oct 22, 2012
Sold by
Norwood Mamie
Bought by
Norwood Joel
Purchase Details
Closed on
Oct 16, 2012
Sold by
Ford Elizabeth
Bought by
Norwood Joel
Purchase Details
Closed on
Oct 8, 2012
Sold by
Richardson Margaret
Bought by
Norwood Joel
Purchase Details
Closed on
Sep 26, 2012
Sold by
Lane Barbafa and Lane Jerome
Bought by
Norwood Joel
Purchase Details
Closed on
Sep 5, 2012
Sold by
Young Mary
Bought by
Norwood Joel
Purchase Details
Closed on
Sep 4, 2012
Sold by
Norwood Juanitta
Bought by
Norwood Joel
Purchase Details
Closed on
Sep 3, 2012
Sold by
Lassiter Bobby and Lassiter Cynthia
Bought by
Norwood Joel
Purchase Details
Closed on
Aug 31, 2012
Sold by
Anderson Christine L and Anderson Charles
Bought by
Norwood Joel
Create a Home Valuation Report for This Property
The Home Valuation Report is an in-depth analysis detailing your home's value as well as a comparison with similar homes in the area
Home Values in the Area
Average Home Value in this Area
Purchase History
| Date | Buyer | Sale Price | Title Company |
|---|---|---|---|
| Bullock Jacqueline N | -- | None Listed On Document | |
| Norwood Joel | $2,000 | None Available | |
| Norwood Joel | -- | None Available | |
| Norwood Joel | -- | None Available | |
| Norwood Joel | $2,000 | None Available | |
| Norwood Joel | $2,000 | None Available | |
| Norwood Joel | $2,000 | None Available | |
| Norwood Joel | $2,000 | None Available | |
| Norwood Joel | $2,000 | None Available |
Source: Public Records
Tax History Compared to Growth
Tax History
| Year | Tax Paid | Tax Assessment Tax Assessment Total Assessment is a certain percentage of the fair market value that is determined by local assessors to be the total taxable value of land and additions on the property. | Land | Improvement |
|---|---|---|---|---|
| 2025 | $669 | $53,995 | $7,600 | $46,395 |
| 2024 | $669 | $53,995 | $7,600 | $46,395 |
| 2023 | $667 | $33,663 | $6,500 | $27,163 |
| 2022 | $523 | $33,663 | $6,500 | $27,163 |
| 2021 | $518 | $33,663 | $6,500 | $27,163 |
| 2020 | $518 | $33,663 | $6,500 | $27,163 |
| 2019 | $518 | $33,663 | $6,500 | $27,163 |
| 2018 | $518 | $33,663 | $6,500 | $27,163 |
| 2016 | $530 | $33,534 | $6,500 | $27,034 |
| 2015 | $508 | $33,534 | $6,500 | $27,034 |
| 2014 | $508 | $33,534 | $6,500 | $27,034 |
| 2013 | -- | $33,534 | $6,500 | $27,034 |
Source: Public Records
Map
Nearby Homes
- 106 Summitt Ave
- 211 Wilmington Ave
- 617 Raleigh St
- 608 Raleigh St
- 504 Henderson St
- 107 Flue Ct
- 501 Raleigh St
- 101 Flue Ct
- 104 Flue Ct
- 504 Rhino Bend
- 100 Flue Ct
- 111 Rhino Bend
- 421 Granville St
- 412 Coggeshall St
- 102 Cultivar St
- 412 Kingsbury St
- 230 Maple Dr Unit 232
- 103 Scoville St
- 501 Benton Dr
- 201 Benton Dr
- 1008 Raleigh St
- 107 Chelsea Dr
- 1000 Raleigh St
- 1012 Raleigh St
- 109 Chelsea Dr
- 102 Star St
- 109 Chelsea Ln
- 1009 Raleigh St
- 1005 Raleigh St
- 104 Star St
- 1003 Raleigh St
- 1100 Raleigh St Unit A & B
- 1001 Raleigh St
- 106 Chelsea Dr
- 103 Star Ave
- 108 Chelsea Dr
- 103 Star St
- 105 Star St
- 203 Chelsea Dr
- 203 Chelsea Ln