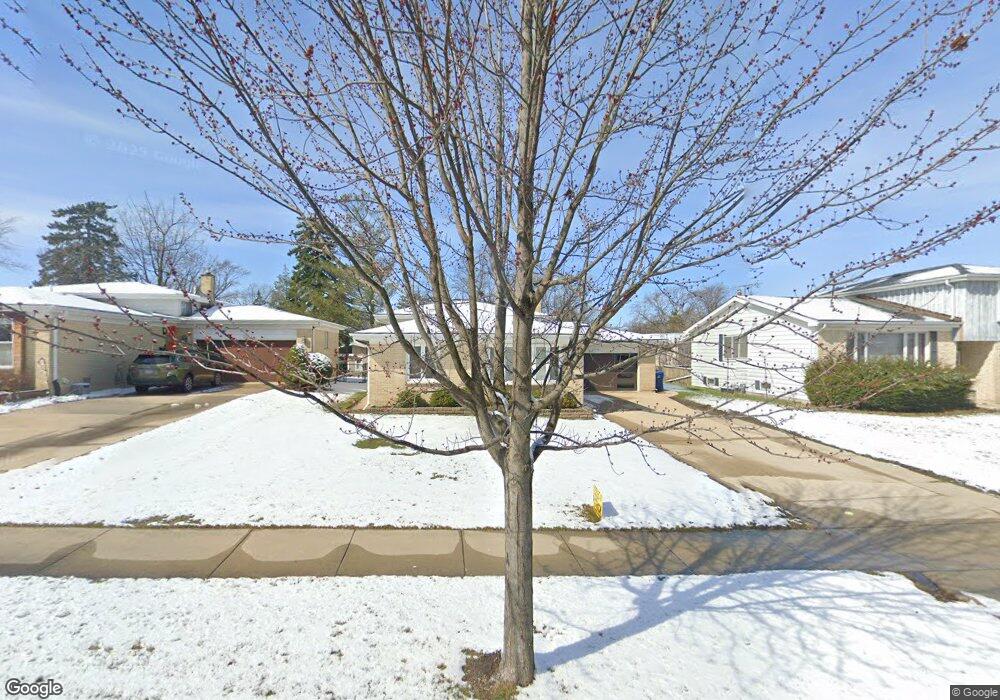
1006 S Villa Ave Villa Park, IL 60181
Estimated Value: $355,000 - $442,000
--
Bed
--
Bath
1,248
Sq Ft
$324/Sq Ft
Est. Value
About This Home
This home is located at 1006 S Villa Ave, Villa Park, IL 60181 and is currently estimated at $404,836, approximately $324 per square foot. 1006 S Villa Ave is a home located in DuPage County with nearby schools including Salt Creek Elementary School, John E Albright Middle School, and Stella May Swartz Elementary School.
Ownership History
Date
Name
Owned For
Owner Type
Purchase Details
Closed on
Jul 2, 2002
Sold by
Jarosz Krystyna and Jarosz Marcin
Bought by
Jarosz Marcin and Barton Anna
Current Estimated Value
Home Financials for this Owner
Home Financials are based on the most recent Mortgage that was taken out on this home.
Original Mortgage
$165,000
Outstanding Balance
$21,922
Interest Rate
6.41%
Estimated Equity
$382,914
Purchase Details
Closed on
Jun 11, 1999
Sold by
Burmester Michael G and Burmester Karen S
Bought by
Jarosz Tomasz
Home Financials for this Owner
Home Financials are based on the most recent Mortgage that was taken out on this home.
Original Mortgage
$119,000
Interest Rate
7.54%
Purchase Details
Closed on
Jun 12, 1998
Sold by
Cosmopolitan Bank & Trust
Bought by
Jarosz Krystyna and Jarosz Marcin
Home Financials for this Owner
Home Financials are based on the most recent Mortgage that was taken out on this home.
Original Mortgage
$136,000
Interest Rate
7.17%
Create a Home Valuation Report for This Property
The Home Valuation Report is an in-depth analysis detailing your home's value as well as a comparison with similar homes in the area
Home Values in the Area
Average Home Value in this Area
Purchase History
| Date | Buyer | Sale Price | Title Company |
|---|---|---|---|
| Jarosz Marcin | -- | -- | |
| Jarosz Tomasz | $149,000 | -- | |
| Jarosz Krystyna | $172,000 | -- |
Source: Public Records
Mortgage History
| Date | Status | Borrower | Loan Amount |
|---|---|---|---|
| Open | Jarosz Marcin | $165,000 | |
| Closed | Jarosz Tomasz | $119,000 | |
| Previous Owner | Jarosz Krystyna | $136,000 |
Source: Public Records
Tax History Compared to Growth
Tax History
| Year | Tax Paid | Tax Assessment Tax Assessment Total Assessment is a certain percentage of the fair market value that is determined by local assessors to be the total taxable value of land and additions on the property. | Land | Improvement |
|---|---|---|---|---|
| 2024 | $6,287 | $115,547 | $27,878 | $87,669 |
| 2023 | $5,620 | $106,850 | $25,780 | $81,070 |
| 2022 | $5,451 | $102,710 | $24,780 | $77,930 |
| 2021 | $5,429 | $100,150 | $24,160 | $75,990 |
| 2020 | $5,314 | $97,950 | $23,630 | $74,320 |
| 2019 | $5,040 | $93,130 | $22,470 | $70,660 |
| 2018 | $4,965 | $87,290 | $21,060 | $66,230 |
| 2017 | $4,856 | $83,180 | $20,070 | $63,110 |
| 2016 | $4,479 | $78,360 | $18,910 | $59,450 |
| 2015 | $4,411 | $73,000 | $17,620 | $55,380 |
| 2014 | $4,582 | $74,820 | $32,050 | $42,770 |
| 2013 | $4,295 | $75,870 | $32,500 | $43,370 |
Source: Public Records
Map
Nearby Homes
- 818 S Villa Ave
- 625 E Van Buren St
- 650 E Van Buren St
- 727 S Oakland Ave
- 1046 E Van Buren St
- 639 S Oakland Ave
- 633 S Monterey Ave
- 613 S Summit Ave
- 2 Ardmore Ave
- 604 S Grant Ave
- 412 E Washington St
- 0S639 Summit Ave
- 5 E Washington St
- 194 Washington St
- 769 S Fairview Ave
- 316 E Highland Ave
- 1500 S Ardmore Ave Unit 408
- 530 E Highland Ave Unit A2
- 740 S Berkley Ave
- 928 S Michigan Ave
- 1002 S Villa Ave
- 1010 S Villa Ave
- 944 S Villa Ave
- 1014 S Villa Ave
- 283 E Julia Dr
- 1011 S Myrtle Ave
- 940 S Villa Ave
- 1015 S Myrtle Ave
- 1020 S Villa Ave
- 1019 S Myrtle Ave
- 1015 S Villa Ave
- 1022 S Villa Ave
- 1023 S Myrtle Ave
- 933 S Villa Ave
- 955 S Villa Ave
- 1026 S Villa Ave
- 1014 S Myrtle Ave
- 1027 S Myrtle Ave
- 941 S Villa Ave
- 1032 S Villa Ave