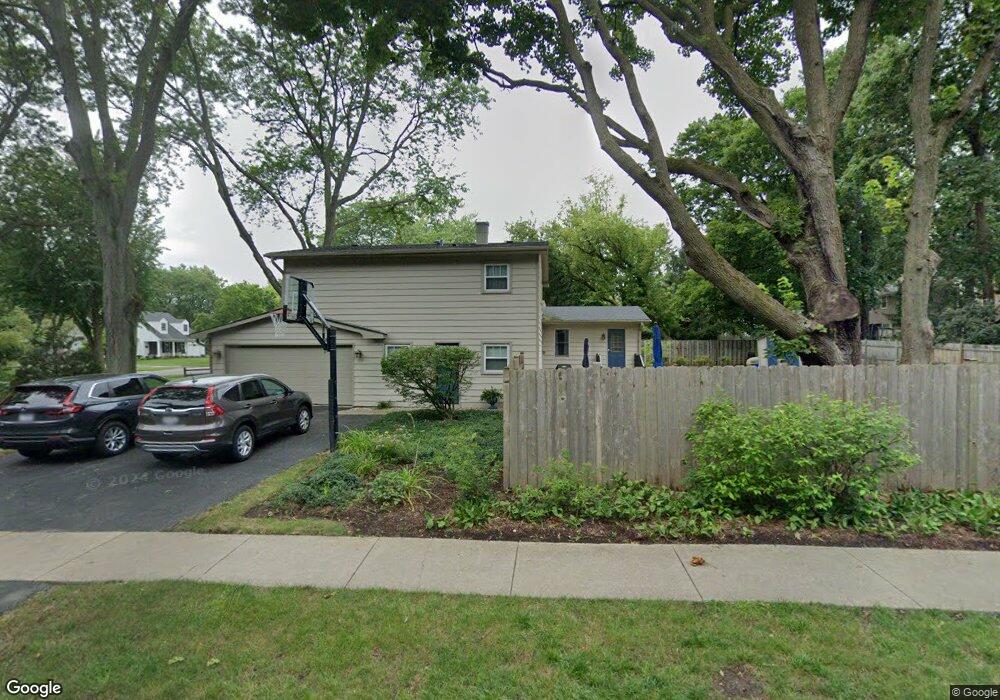
1006 Shari Ln Libertyville, IL 60048
South Libertyville NeighborhoodEstimated Value: $499,000 - $595,000
--
Bed
3
Baths
1,611
Sq Ft
$338/Sq Ft
Est. Value
About This Home
This home is located at 1006 Shari Ln, Libertyville, IL 60048 and is currently estimated at $543,833, approximately $337 per square foot. 1006 Shari Ln is a home located in Lake County with nearby schools including Rockland Elementary School, Highland Middle School, and Libertyville High School.
Ownership History
Date
Name
Owned For
Owner Type
Purchase Details
Closed on
Jan 25, 2016
Sold by
Rogers James E and Rogers Maureen O
Bought by
Rogers Family 2016 Trust
Current Estimated Value
Purchase Details
Closed on
Feb 15, 1995
Sold by
Wancho Allen T and Wancho Amy L
Bought by
Rogers James E and Rogers Maureen O
Home Financials for this Owner
Home Financials are based on the most recent Mortgage that was taken out on this home.
Original Mortgage
$120,000
Interest Rate
9.26%
Create a Home Valuation Report for This Property
The Home Valuation Report is an in-depth analysis detailing your home's value as well as a comparison with similar homes in the area
Home Values in the Area
Average Home Value in this Area
Purchase History
| Date | Buyer | Sale Price | Title Company |
|---|---|---|---|
| Rogers Family 2016 Trust | -- | Attorney | |
| Rogers James E | $215,000 | Imperial Land Title |
Source: Public Records
Mortgage History
| Date | Status | Borrower | Loan Amount |
|---|---|---|---|
| Closed | Rogers James E | $120,000 |
Source: Public Records
Tax History Compared to Growth
Tax History
| Year | Tax Paid | Tax Assessment Tax Assessment Total Assessment is a certain percentage of the fair market value that is determined by local assessors to be the total taxable value of land and additions on the property. | Land | Improvement |
|---|---|---|---|---|
| 2024 | $9,614 | $146,770 | $66,439 | $80,331 |
| 2023 | $9,614 | $135,371 | $61,279 | $74,092 |
| 2022 | $9,643 | $131,567 | $58,900 | $72,667 |
| 2021 | $9,272 | $128,735 | $57,632 | $71,103 |
| 2020 | $8,915 | $126,571 | $56,663 | $69,908 |
| 2019 | $8,695 | $125,367 | $56,124 | $69,243 |
| 2018 | $8,547 | $124,909 | $54,799 | $70,110 |
| 2017 | $8,609 | $120,966 | $53,069 | $67,897 |
| 2016 | $8,318 | $114,693 | $50,317 | $64,376 |
| 2015 | $8,235 | $107,200 | $47,030 | $60,170 |
| 2014 | $8,162 | $104,229 | $44,190 | $60,039 |
| 2012 | $7,886 | $105,133 | $44,573 | $60,560 |
Source: Public Records
Map
Nearby Homes
- 533 Drake St
- 1137 Pine Tree Ln
- 1330 W Park Ave
- 0 Ames St
- 423 Ames St
- 20924 & 20902 W Park Ave
- 223 Kenloch Ave
- 551 W Park Ave Unit E
- 777 Garfield Ave Unit A
- 747 Garfield Ave Unit C
- 1017 Juniper Pkwy
- 308 Mckinley Ave
- 851 Garfield Ave Unit C
- 323 W Golf Rd
- 1754 Glenmore Rd
- 2245 Hazeltime Dr
- 501 Hemlock Ln
- 420 W Cook Ave
- 212 Elm Ct
- 505 Lange Ct