1006 W Fremont Ave Unit N. 11th W. Riverton, WY 82501
Estimated Value: $178,000 - $255,989
3
Beds
1
Bath
2,192
Sq Ft
$103/Sq Ft
Est. Value
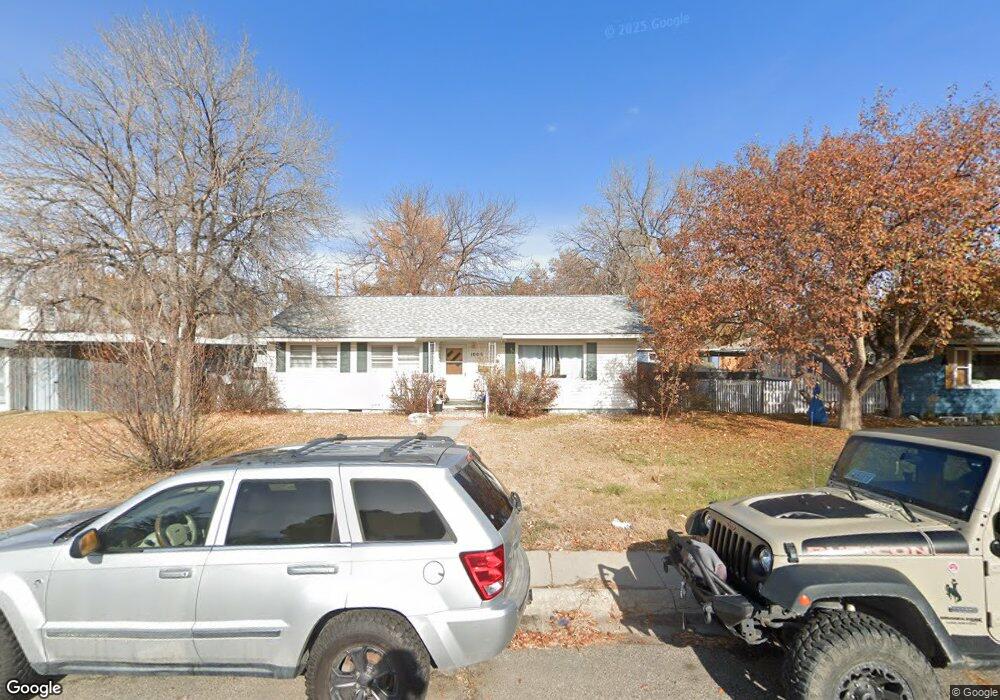
About This Home
This home is located at 1006 W Fremont Ave Unit N. 11th W., Riverton, WY 82501 and is currently estimated at $225,247, approximately $102 per square foot. 1006 W Fremont Ave Unit N. 11th W. is a home located in Fremont County with nearby schools including Riverton High School, Trinity Lutheran School, and St. Margaret Catholic School.
Ownership History
Date
Name
Owned For
Owner Type
Purchase Details
Closed on
May 23, 2021
Sold by
Randolph Derek
Bought by
Laber Melissa Jean
Current Estimated Value
Home Financials for this Owner
Home Financials are based on the most recent Mortgage that was taken out on this home.
Original Mortgage
$164,957
Outstanding Balance
$149,259
Interest Rate
3%
Mortgage Type
FHA
Estimated Equity
$75,989
Purchase Details
Closed on
May 14, 2013
Sold by
Brennan Matt R
Bought by
Randolph Derek
Home Financials for this Owner
Home Financials are based on the most recent Mortgage that was taken out on this home.
Original Mortgage
$170,408
Interest Rate
3.56%
Mortgage Type
New Conventional
Purchase Details
Closed on
Jul 23, 2010
Sold by
Rau Mary Anne
Bought by
Brennan Matt R
Create a Home Valuation Report for This Property
The Home Valuation Report is an in-depth analysis detailing your home's value as well as a comparison with similar homes in the area
Home Values in the Area
Average Home Value in this Area
Purchase History
| Date | Buyer | Sale Price | Title Company |
|---|---|---|---|
| Laber Melissa Jean | -- | None Available | |
| Randolph Derek | -- | None Available | |
| Brennan Matt R | -- | Fremont County Title |
Source: Public Records
Mortgage History
| Date | Status | Borrower | Loan Amount |
|---|---|---|---|
| Open | Laber Melissa Jean | $164,957 | |
| Previous Owner | Randolph Derek | $170,408 |
Source: Public Records
Tax History Compared to Growth
Tax History
| Year | Tax Paid | Tax Assessment Tax Assessment Total Assessment is a certain percentage of the fair market value that is determined by local assessors to be the total taxable value of land and additions on the property. | Land | Improvement |
|---|---|---|---|---|
| 2025 | $1,602 | $16,225 | $2,926 | $13,299 |
| 2024 | $1,602 | $20,471 | $3,901 | $16,570 |
| 2023 | $1,587 | $19,886 | $3,901 | $15,985 |
| 2022 | $1,367 | $17,492 | $3,901 | $13,591 |
| 2021 | $1,333 | $16,571 | $3,901 | $12,670 |
| 2020 | $1,178 | $14,650 | $3,901 | $10,749 |
| 2019 | $1,273 | $16,193 | $3,901 | $12,292 |
| 2018 | $1,291 | $16,461 | $3,901 | $12,560 |
| 2017 | $1,397 | $16,490 | $3,901 | $12,589 |
| 2016 | $1,290 | $15,284 | $3,901 | $11,383 |
| 2015 | $1,186 | $15,255 | $3,901 | $11,354 |
| 2014 | $1,166 | $14,748 | $3,576 | $11,172 |
Source: Public Records
Map
Nearby Homes
- 1113 Fairview Dr
- 1221 Fairview Dr
- 409 Northpointe Dr
- 1005 Hillside Ave
- 621 W Fremont Ave
- 0 Major Lot 4 Ave
- 220 N 5th St W
- 210 N 5th St W
- 2110 Riverview
- 2155 Riverview
- 604 Meadowlark Ln
- 121 W Adams Ave
- 207 W Madison Ave
- Lot 2 Parkview
- 117 W Madison Ave
- 755 N 2nd St W
- 524 N 2nd St E
- 922 Sierra Dr
- 518 N 3rd St E
- 510 N 3rd St E
- 1006 W Fremont Ave
- 1004 W Fremont Ave
- 201 N 11th St W Unit Fremont
- 1005 W Park Ave
- 1002 W Fremont Ave
- 218 N 10th St W
- 218 N 10th St W Unit Park
- 1005 W Fremont Ave
- 121 N 11th St W
- 121 N 11th St W Unit W Fremont
- 121 N 11th St W Unit W. Main
- 1003 W Fremont Ave
- 118 N 10th St W
- 922 W Fremont Ave
- 213 N 10th St W
- 219 N 10th St W
- 119 N 10th St W
- 920 W Fremont Ave
- 1004 W Park Ave
- 919 W Fremont Ave