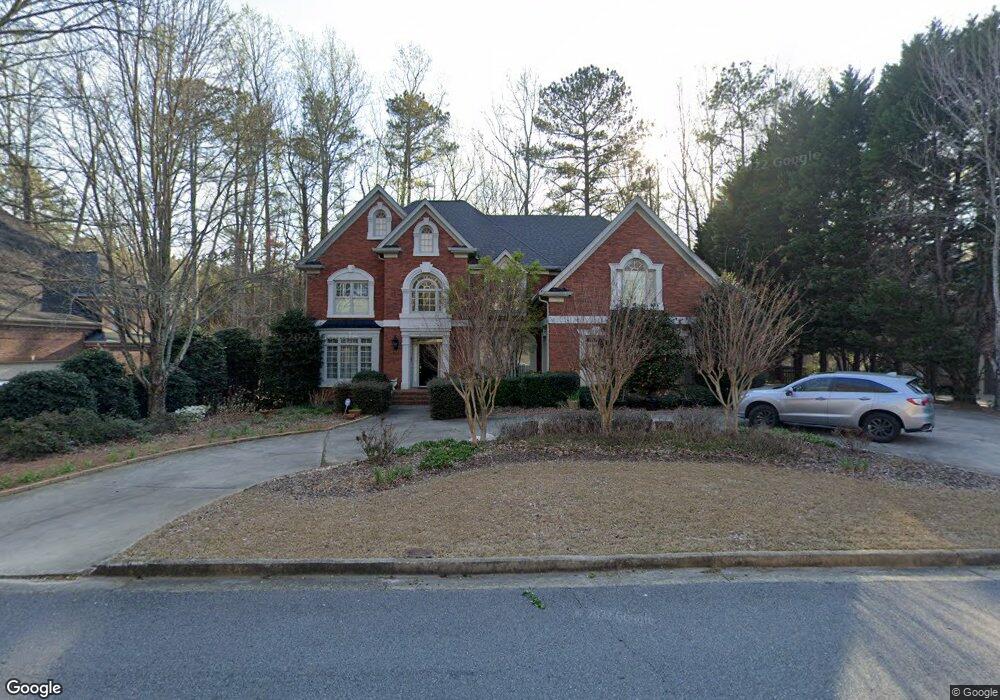
10060 High Falls Point Alpharetta, GA 30022
Estimated Value: $1,159,466 - $1,463,000
6
Beds
5
Baths
3,750
Sq Ft
$354/Sq Ft
Est. Value
About This Home
This home is located at 10060 High Falls Point, Alpharetta, GA 30022 and is currently estimated at $1,326,117, approximately $353 per square foot. 10060 High Falls Point is a home located in Fulton County with nearby schools including Dolvin Elementary School, Autrey Mill Middle School, and Johns Creek High School.
Ownership History
Date
Name
Owned For
Owner Type
Purchase Details
Closed on
Nov 2, 2012
Sold by
Mossburg Emily J
Bought by
Wang Haiqun and Le Xuewen
Current Estimated Value
Home Financials for this Owner
Home Financials are based on the most recent Mortgage that was taken out on this home.
Original Mortgage
$415,000
Outstanding Balance
$286,909
Interest Rate
3.4%
Mortgage Type
New Conventional
Estimated Equity
$1,039,208
Purchase Details
Closed on
Jan 12, 2007
Sold by
Gay Christopher M and Gay Ann M
Bought by
Mossburg James E and Mossburg Emily J
Home Financials for this Owner
Home Financials are based on the most recent Mortgage that was taken out on this home.
Original Mortgage
$558,400
Interest Rate
6.05%
Mortgage Type
New Conventional
Purchase Details
Closed on
Apr 2, 1996
Sold by
Neese Const Inc
Bought by
Lemke Mark A
Purchase Details
Closed on
Jan 26, 1994
Sold by
Jv Brooks Cowart
Bought by
Neese Const Inc
Home Financials for this Owner
Home Financials are based on the most recent Mortgage that was taken out on this home.
Original Mortgage
$78,500
Interest Rate
7.1%
Create a Home Valuation Report for This Property
The Home Valuation Report is an in-depth analysis detailing your home's value as well as a comparison with similar homes in the area
Home Values in the Area
Average Home Value in this Area
Purchase History
| Date | Buyer | Sale Price | Title Company |
|---|---|---|---|
| Wang Haiqun | $540,000 | -- | |
| Mossburg James E | $698,000 | -- | |
| Lemke Mark A | $466,000 | -- | |
| Neese Const Inc | $78,500 | -- |
Source: Public Records
Mortgage History
| Date | Status | Borrower | Loan Amount |
|---|---|---|---|
| Open | Wang Haiqun | $415,000 | |
| Previous Owner | Mossburg James E | $558,400 | |
| Previous Owner | Neese Const Inc | $78,500 | |
| Closed | Lemke Mark A | $0 |
Source: Public Records
Tax History Compared to Growth
Tax History
| Year | Tax Paid | Tax Assessment Tax Assessment Total Assessment is a certain percentage of the fair market value that is determined by local assessors to be the total taxable value of land and additions on the property. | Land | Improvement |
|---|---|---|---|---|
| 2025 | $7,765 | $356,360 | $120,440 | $235,920 |
| 2023 | $7,339 | $260,000 | $68,800 | $191,200 |
| 2022 | $7,425 | $260,000 | $68,800 | $191,200 |
| 2021 | $7,202 | $282,920 | $71,560 | $211,360 |
| 2020 | $7,448 | $251,960 | $67,840 | $184,120 |
| 2019 | $791 | $251,960 | $67,840 | $184,120 |
| 2018 | $7,025 | $268,200 | $67,840 | $200,360 |
| 2017 | $7,383 | $229,080 | $53,920 | $175,160 |
| 2016 | $7,238 | $229,080 | $53,920 | $175,160 |
| 2015 | $7,315 | $229,080 | $53,920 | $175,160 |
| 2014 | $7,540 | $229,080 | $53,920 | $175,160 |
Source: Public Records
Map
Nearby Homes
- 115 Thome Dr
- 350 Waters Bend Way
- 3815 Falls Landing Dr
- 10090 Jones Bridge Rd Unit 8
- 125 Oak Bridge Ct Unit 2
- 510 Winborne Place Unit VI
- 10415 Plantation Bridge Dr
- 320 Outwood Mill Ct
- 170 Autry Trail
- 2005 Westbourne Way Unit 2
- 10050 Lauren Hall Ct
- 10405 Meadow Crest Ln
- 10000 Barston Ct
- 120 Thome Dr
- 3765 Redcoat Way
- 10325 Oxford Mill Cir Unit 1
- 9925 Lauren Hall Ct
- 130 Colony Run
- 595 Oak Alley Way
- 10515 Colony Glen Dr Unit 2
- 10060 High Falls Point Unit 1
- 10060 High Falls Pointe
- 10050 High Falls Pointe Unit 1
- 10070 High Falls Pointe Unit 4
- 10040 High Falls Pointe
- 10080 High Falls Point
- 10080 High Falls Pointe
- 10080 High Falls Pte
- 10065 High Falls Pointe Unit 1
- 3950 Falls Ridge Dr
- 10075 High Falls Pointe Unit 4
- 10090 High Falls Point
- 10030 High Falls Pointe
- 10030 High Falls Pte
- 10030 High Falls
- 10030 High Falls Point
- 10090 High Falls Pointe
- 230 Azalea Cove Ln Unit 4
- 3960 Falls Ridge Dr Unit 1
- 10085 High Falls Point Unit 4