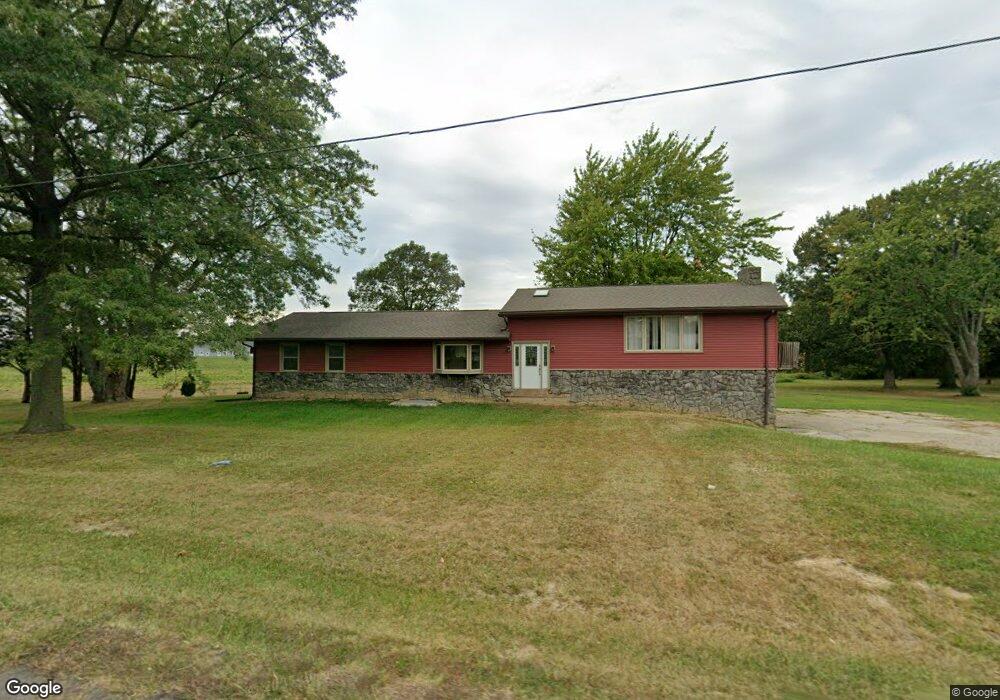
10064 Akron Rd Rittman, OH 44270
Estimated Value: $268,969 - $338,000
3
Beds
1
Bath
2,080
Sq Ft
$145/Sq Ft
Est. Value
About This Home
This home is located at 10064 Akron Rd, Rittman, OH 44270 and is currently estimated at $300,992, approximately $144 per square foot. 10064 Akron Rd is a home located in Wayne County with nearby schools including Norwayne Elementary School, Norwayne Middle School, and Norwayne High School.
Ownership History
Date
Name
Owned For
Owner Type
Purchase Details
Closed on
Dec 16, 2011
Sold by
Older Frederick and Boliantz Jenna
Bought by
Mills Travis D and Mills Jessica M
Current Estimated Value
Home Financials for this Owner
Home Financials are based on the most recent Mortgage that was taken out on this home.
Original Mortgage
$80,288
Outstanding Balance
$54,949
Interest Rate
4.02%
Mortgage Type
New Conventional
Estimated Equity
$246,043
Purchase Details
Closed on
Jul 22, 1988
Sold by
Older Ii William D and Older Joyc
Bought by
Older Joyce and Older Joyce A
Create a Home Valuation Report for This Property
The Home Valuation Report is an in-depth analysis detailing your home's value as well as a comparison with similar homes in the area
Home Values in the Area
Average Home Value in this Area
Purchase History
| Date | Buyer | Sale Price | Title Company |
|---|---|---|---|
| Mills Travis D | $58,200 | Kingdom Title Solutions Inc | |
| Older Joyce | -- | -- |
Source: Public Records
Mortgage History
| Date | Status | Borrower | Loan Amount |
|---|---|---|---|
| Open | Mills Travis D | $80,288 |
Source: Public Records
Tax History Compared to Growth
Tax History
| Year | Tax Paid | Tax Assessment Tax Assessment Total Assessment is a certain percentage of the fair market value that is determined by local assessors to be the total taxable value of land and additions on the property. | Land | Improvement |
|---|---|---|---|---|
| 2024 | $3,139 | $82,780 | $13,880 | $68,900 |
| 2023 | $3,139 | $82,780 | $13,880 | $68,900 |
| 2022 | $2,463 | $62,240 | $10,440 | $51,800 |
| 2021 | $2,491 | $62,240 | $10,440 | $51,800 |
| 2020 | $2,507 | $62,240 | $10,440 | $51,800 |
| 2019 | $1,819 | $43,590 | $9,390 | $34,200 |
| 2018 | $1,806 | $43,590 | $9,390 | $34,200 |
| 2017 | $1,736 | $43,590 | $9,390 | $34,200 |
| 2016 | $1,703 | $41,520 | $8,950 | $32,570 |
| 2015 | $1,681 | $41,520 | $8,950 | $32,570 |
| 2014 | $1,645 | $41,520 | $8,950 | $32,570 |
| 2013 | $1,556 | $38,140 | $6,870 | $31,270 |
Source: Public Records
Map
Nearby Homes