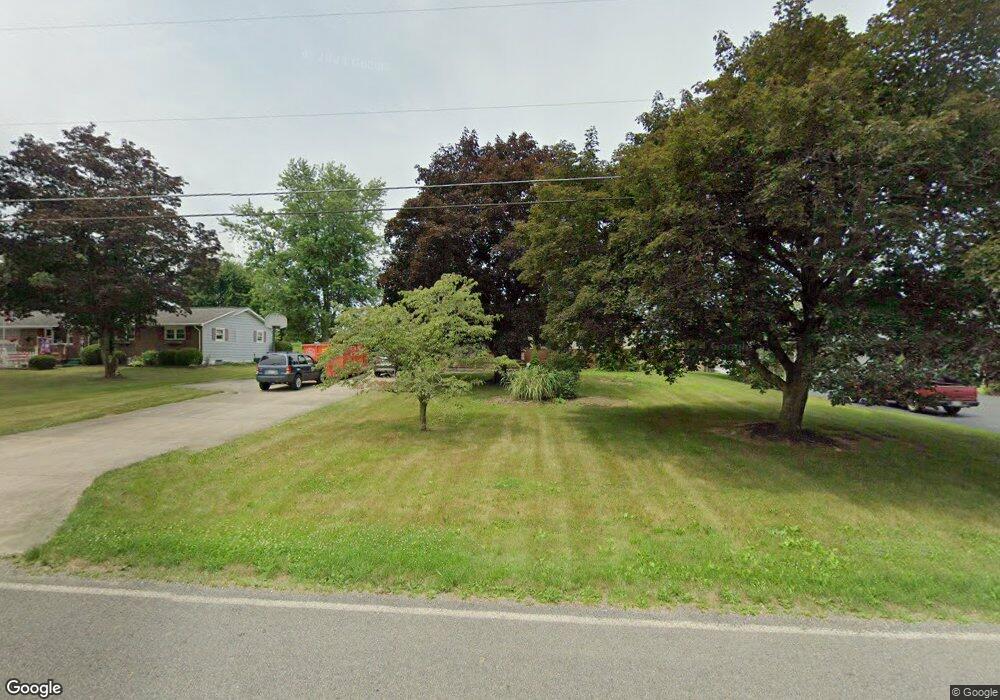
10069 Mccallum Ave NE Alliance, OH 44601
Estimated Value: $202,000 - $260,000
3
Beds
2
Baths
1,196
Sq Ft
$189/Sq Ft
Est. Value
About This Home
This home is located at 10069 Mccallum Ave NE, Alliance, OH 44601 and is currently estimated at $226,600, approximately $189 per square foot. 10069 Mccallum Ave NE is a home located in Stark County with nearby schools including Marlington High School and Regina Coeli/St Joseph School.
Ownership History
Date
Name
Owned For
Owner Type
Purchase Details
Closed on
Jul 12, 2024
Sold by
Brooks Samuel E
Bought by
Berry Kelli M
Current Estimated Value
Purchase Details
Closed on
May 10, 2017
Sold by
Brooks Samuel E and Brooks Laura A
Bought by
Brooks Samuel E and Brooks Laura A
Create a Home Valuation Report for This Property
The Home Valuation Report is an in-depth analysis detailing your home's value as well as a comparison with similar homes in the area
Home Values in the Area
Average Home Value in this Area
Purchase History
| Date | Buyer | Sale Price | Title Company |
|---|---|---|---|
| Berry Kelli M | $142,800 | None Listed On Document | |
| Brooks Samuel E | -- | None Available |
Source: Public Records
Tax History Compared to Growth
Tax History
| Year | Tax Paid | Tax Assessment Tax Assessment Total Assessment is a certain percentage of the fair market value that is determined by local assessors to be the total taxable value of land and additions on the property. | Land | Improvement |
|---|---|---|---|---|
| 2025 | -- | $63,770 | $19,320 | $44,450 |
| 2024 | -- | $63,770 | $19,320 | $44,450 |
| 2023 | $1,439 | $49,990 | $10,960 | $39,030 |
| 2022 | $1,459 | $49,990 | $10,960 | $39,030 |
| 2021 | $1,464 | $49,990 | $10,960 | $39,030 |
| 2020 | $1,381 | $43,410 | $9,420 | $33,990 |
| 2019 | $1,371 | $43,410 | $9,420 | $33,990 |
| 2018 | $1,373 | $43,410 | $9,420 | $33,990 |
| 2017 | $1,311 | $39,700 | $7,000 | $32,700 |
| 2016 | $1,364 | $40,960 | $8,260 | $32,700 |
| 2015 | $1,299 | $40,960 | $8,260 | $32,700 |
| 2014 | $1,294 | $38,060 | $7,670 | $30,390 |
| 2013 | $644 | $38,060 | $7,670 | $30,390 |
Source: Public Records
Map
Nearby Homes
- 10666 Wilma Ave NE
- 0 Reeder Ave NE
- 13334 Cindy St NE
- 2377 Ansley St Unit 2377
- 0 Meadow St NE
- 1430 Westwood Ave
- 2081 Marwood Cir
- 2851 Patriots Path Unit 3D
- 0 W Main St Unit 5090123
- 12355 Edison St NE
- 2435 Queensbury Rd
- 11960 Freshley Ave NE
- 11480 Aebi Ave NE
- 0 Valewood Cir Unit 5006281
- 13109 Edison St NE
- 0 Easton St NE
- 12415 Snode St NE
- 1201 Overlook Dr
- 000 Klinger Ave
- 2220 Western Ave
- 10049 Mccallum Ave NE
- 10087 Mccallum Ave NE
- 10029 Mccallum Ave NE
- 10009 Mccallum Ave NE
- 10080 Mccallum Ave NE
- 10135 Mccallum Ave NE
- 10106 Mccallum Ave NE
- 10004 Mccallum Ave NE
- 10012 Mccallum Ave NE
- 10161 Mccallum Ave NE
- 10000 Mccallum Ave NE
- 9951 Mccallum Ave NE
- 9966 Mccallum Ave NE
- 10050 Mccallum Ave NE
- 10136 Mccallum Ave NE
- 10201 Mccallum Ave NE
- 9931 Mccallum Ave NE
- 10170 Mccallum Ave NE
- 9930 Mccallum Ave NE
- 10156 Mccallum Ave NE