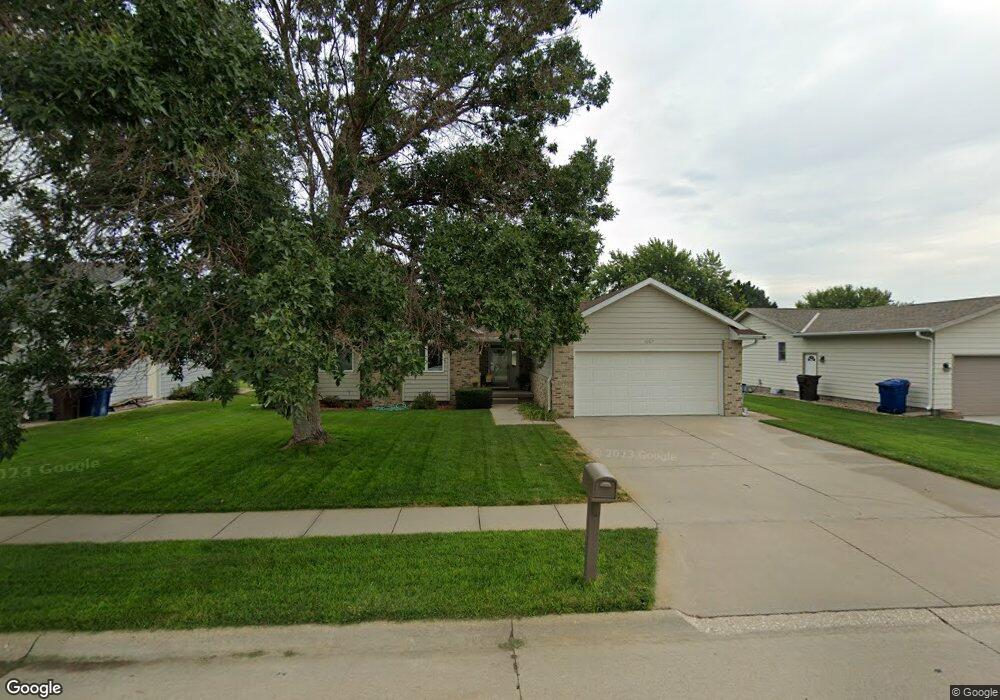
1007 11th Ave Kearney, NE 68845
Estimated Value: $289,186 - $349,000
3
Beds
2
Baths
1,370
Sq Ft
$239/Sq Ft
Est. Value
About This Home
This home is located at 1007 11th Ave, Kearney, NE 68845 and is currently estimated at $328,047, approximately $239 per square foot. 1007 11th Ave is a home located in Buffalo County with nearby schools including Kenwood Elementary School, Horizon Middle School, and Kearney Senior High School.
Ownership History
Date
Name
Owned For
Owner Type
Purchase Details
Closed on
Sep 25, 2008
Sold by
Hsbc Bank Usa Na
Bought by
Martin Albert M and Martin Carla S
Current Estimated Value
Home Financials for this Owner
Home Financials are based on the most recent Mortgage that was taken out on this home.
Original Mortgage
$140,000
Outstanding Balance
$93,720
Interest Rate
6.57%
Estimated Equity
$234,327
Purchase Details
Closed on
Jun 20, 2008
Sold by
Mccubbin Garry
Bought by
Hsbc Bank Usa Na
Purchase Details
Closed on
Jun 17, 2005
Sold by
Prescott John C and Prescott Karen K
Bought by
Henson Curtis C and Henson Amanda M
Home Financials for this Owner
Home Financials are based on the most recent Mortgage that was taken out on this home.
Original Mortgage
$125,800
Interest Rate
5.67%
Create a Home Valuation Report for This Property
The Home Valuation Report is an in-depth analysis detailing your home's value as well as a comparison with similar homes in the area
Home Values in the Area
Average Home Value in this Area
Purchase History
| Date | Buyer | Sale Price | Title Company |
|---|---|---|---|
| Martin Albert M | -- | -- | |
| Hsbc Bank Usa Na | -- | Kozeny And Mccubbin | |
| Henson Curtis C | $158,500 | -- |
Source: Public Records
Mortgage History
| Date | Status | Borrower | Loan Amount |
|---|---|---|---|
| Open | Martin Albert M | $140,000 | |
| Previous Owner | Henson Curtis C | $125,800 | |
| Previous Owner | Henson Curtis C | $31,700 |
Source: Public Records
Tax History
| Year | Tax Paid | Tax Assessment Tax Assessment Total Assessment is a certain percentage of the fair market value that is determined by local assessors to be the total taxable value of land and additions on the property. | Land | Improvement |
|---|---|---|---|---|
| 2025 | $3,758 | $292,485 | $43,705 | $248,780 |
| 2024 | $4,127 | $260,275 | $42,430 | $217,845 |
| 2023 | $4,127 | $242,490 | $42,430 | $200,060 |
| 2022 | $4,399 | $250,665 | $57,725 | $192,940 |
| 2021 | $4,098 | $237,620 | $52,920 | $184,700 |
| 2020 | $4,096 | $236,810 | $52,920 | $183,890 |
| 2019 | $3,794 | $216,705 | $50,400 | $166,305 |
| 2018 | $3,966 | $229,790 | $50,400 | $179,390 |
| 2017 | $3,706 | $216,145 | $35,155 | $180,990 |
| 2016 | $3,500 | $205,805 | $35,155 | $170,650 |
| 2015 | $3,074 | $176,705 | $0 | $0 |
| 2014 | $3,367 | $176,615 | $0 | $0 |
Source: Public Records
Map
Nearby Homes
Your Personal Tour Guide
Ask me questions while you tour the home.