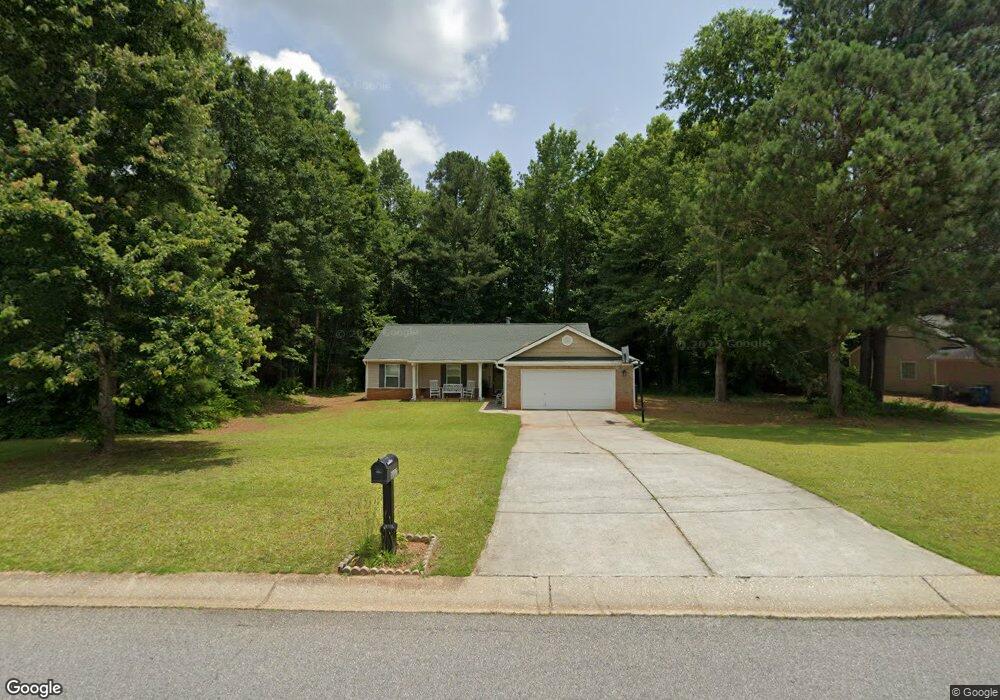
1007 Bowman Way Winder, GA 30680
Estimated Value: $313,220 - $348,000
3
Beds
2
Baths
1,320
Sq Ft
$251/Sq Ft
Est. Value
About This Home
This home is located at 1007 Bowman Way, Winder, GA 30680 and is currently estimated at $331,805, approximately $251 per square foot. 1007 Bowman Way is a home located in Barrow County with nearby schools including Statham Elementary School, Bear Creek Middle School, and Winder-Barrow High School.
Ownership History
Date
Name
Owned For
Owner Type
Purchase Details
Closed on
Jun 24, 2008
Sold by
Martin Plorn A
Bought by
Kun Plorn A
Current Estimated Value
Purchase Details
Closed on
Sep 15, 2006
Sold by
Kun Plorn A
Bought by
Martin Plorn A
Home Financials for this Owner
Home Financials are based on the most recent Mortgage that was taken out on this home.
Original Mortgage
$127,800
Interest Rate
6.39%
Mortgage Type
New Conventional
Purchase Details
Closed on
May 28, 2004
Sold by
Star Hm Builders Inc
Bought by
Kun Piorn A
Home Financials for this Owner
Home Financials are based on the most recent Mortgage that was taken out on this home.
Original Mortgage
$23,800
Interest Rate
5.98%
Mortgage Type
New Conventional
Purchase Details
Closed on
Dec 10, 2003
Sold by
Steele and Carter Development, L
Bought by
Star Home Builders Inc
Purchase Details
Closed on
Jan 3, 2003
Bought by
Steele & Carter Development Llc
Create a Home Valuation Report for This Property
The Home Valuation Report is an in-depth analysis detailing your home's value as well as a comparison with similar homes in the area
Home Values in the Area
Average Home Value in this Area
Purchase History
| Date | Buyer | Sale Price | Title Company |
|---|---|---|---|
| Kun Plorn A | -- | -- | |
| Martin Plorn A | -- | -- | |
| Kun Piorn A | $118,900 | -- | |
| Star Home Builders Inc | $640,000 | -- | |
| Steele & Carter Development Llc | -- | -- |
Source: Public Records
Mortgage History
| Date | Status | Borrower | Loan Amount |
|---|---|---|---|
| Previous Owner | Martin Plorn A | $127,800 | |
| Previous Owner | Kun Piorn A | $23,800 |
Source: Public Records
Tax History
| Year | Tax Paid | Tax Assessment Tax Assessment Total Assessment is a certain percentage of the fair market value that is determined by local assessors to be the total taxable value of land and additions on the property. | Land | Improvement |
|---|---|---|---|---|
| 2025 | $2,037 | $96,052 | $25,200 | $70,852 |
| 2024 | $2,116 | $93,982 | $25,200 | $68,782 |
| 2023 | $1,712 | $94,582 | $25,200 | $69,382 |
| 2022 | $1,774 | $65,732 | $21,600 | $44,132 |
| 2021 | $1,596 | $54,690 | $16,000 | $38,690 |
| 2020 | $1,594 | $54,690 | $16,000 | $38,690 |
| 2019 | $1,617 | $54,690 | $16,000 | $38,690 |
| 2018 | $1,528 | $51,890 | $13,200 | $38,690 |
| 2017 | $1,219 | $41,853 | $13,200 | $28,653 |
| 2016 | $1,231 | $42,168 | $13,200 | $28,968 |
| 2015 | $1,245 | $42,483 | $13,200 | $29,283 |
| 2014 | $1,071 | $36,556 | $6,958 | $29,598 |
| 2013 | -- | $35,112 | $6,958 | $28,154 |
Source: Public Records
Map
Nearby Homes
- 212 W Sycamore Dr
- 276 Bowman Mill Rd SE
- 00 Bird Hammond Rd
- 1283 Kesler Rd
- 1200 Breckinridge Trail
- 160 Azalea Dr
- 316 Hardigree Dr
- 154 Azalea Dr
- 0 Giles Rd Unit 10539344
- 0 Bowman Mill Rd NE Unit 7698431
- 0 Bowman Mill Rd NE Unit 10664956
- 1209 Autumn Ave
- 332 Hardigree Dr
- 66 Westlyn Way
- The Landon II Plan at Westlyn
- The Rosewood Plan at Westlyn
- The Blackburn Plan at Westlyn
- The Lakehurst Plan at Westlyn
- 61 Westlyn Ln
- 246 Pleasant Hill Church Rd NE
- 1009 Bowman Way
- 1011 Bowman Way
- 1001 Bowman Way
- 1004 Bowman Way
- 1010 Bowman Way
- 1006 Bowman Way
- 1013 Bowman Way
- 1008 Bowman Way
- 1012 Bowman Way
- 1002 Bowman Way
- 1015 Bowman Way
- 238 Bowman Mill Rd SE
- 1014 Bowman Way
- 1014 Bowman Way Unit 56
- 1000 Bowman Way
- 1017 Bowman Way
- 174 Bowman Mill Rd SE
- 1243 Alex Dr
- 1241 Alex Dr
- 1239 Alex Dr
Your Personal Tour Guide
Ask me questions while you tour the home.