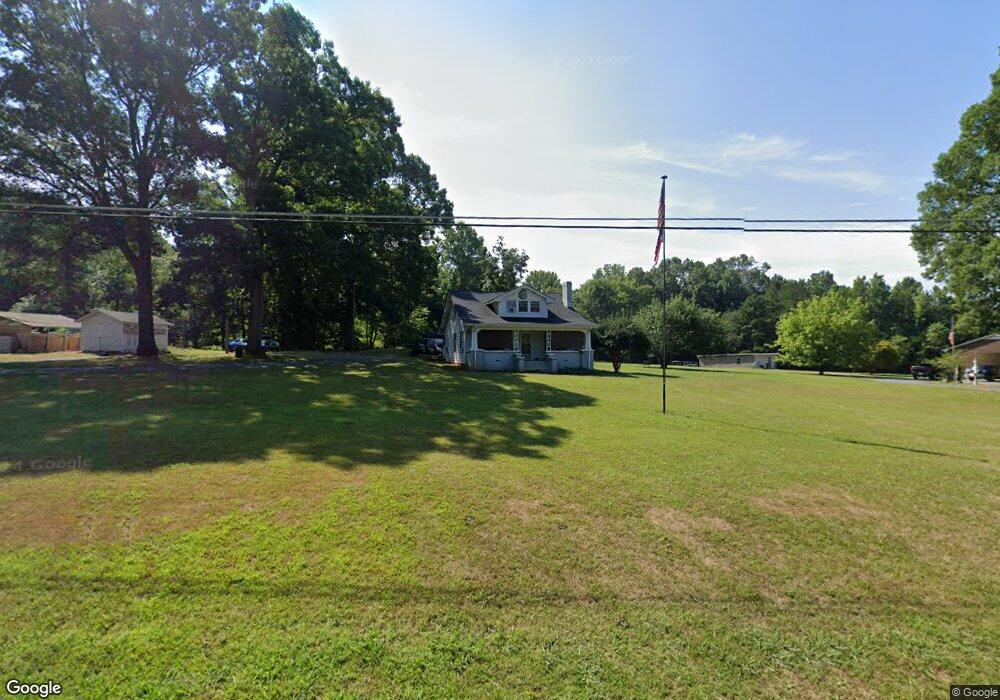
1007 Brooklyn Avenue Extension Ramseur, NC 27316
Estimated Value: $122,000 - $192,000
--
Bed
1
Bath
1,506
Sq Ft
$104/Sq Ft
Est. Value
About This Home
This home is located at 1007 Brooklyn Avenue Extension, Ramseur, NC 27316 and is currently estimated at $156,508, approximately $103 per square foot. 1007 Brooklyn Avenue Extension is a home located in Randolph County with nearby schools including Ramseur Elementary School, Southeastern Randolph Middle School, and Eastern Randolph High School.
Ownership History
Date
Name
Owned For
Owner Type
Purchase Details
Closed on
Dec 7, 2021
Sold by
Herman Atkinson Neal and Herman Susan W
Bought by
Caviness William Christopher
Current Estimated Value
Home Financials for this Owner
Home Financials are based on the most recent Mortgage that was taken out on this home.
Original Mortgage
$87,505
Outstanding Balance
$80,294
Interest Rate
3.09%
Mortgage Type
FHA
Estimated Equity
$76,214
Purchase Details
Closed on
Dec 9, 2016
Sold by
Curtis Quinn Lecy Allen and Curtis Steve
Bought by
Randolph Heritage Conservancy Inc
Purchase Details
Closed on
May 9, 2016
Sold by
Stanley Mary Elizabeth Kivett
Bought by
Atkinson Neal H and Atkinson Susan W
Purchase Details
Closed on
Mar 21, 2005
Sold by
Kivett Selma T
Bought by
Kivett Forbis Lee and Kivett Raynita Anne Conklin
Create a Home Valuation Report for This Property
The Home Valuation Report is an in-depth analysis detailing your home's value as well as a comparison with similar homes in the area
Home Values in the Area
Average Home Value in this Area
Purchase History
| Date | Buyer | Sale Price | Title Company |
|---|---|---|---|
| Caviness William Christopher | $90,000 | None Listed On Document | |
| Randolph Heritage Conservancy Inc | -- | None Available | |
| Atkinson Neal H | $75,000 | None Available | |
| Kivett Stanley Mary Elizabeth | -- | None Available | |
| Kivett Forbis Lee | -- | -- |
Source: Public Records
Mortgage History
| Date | Status | Borrower | Loan Amount |
|---|---|---|---|
| Open | Caviness William Christopher | $87,505 |
Source: Public Records
Tax History Compared to Growth
Tax History
| Year | Tax Paid | Tax Assessment Tax Assessment Total Assessment is a certain percentage of the fair market value that is determined by local assessors to be the total taxable value of land and additions on the property. | Land | Improvement |
|---|---|---|---|---|
| 2025 | $724 | $113,100 | $37,860 | $75,240 |
| 2024 | $724 | $113,100 | $37,860 | $75,240 |
| 2023 | $724 | $113,100 | $37,860 | $75,240 |
| 2022 | $589 | $76,260 | $24,160 | $52,100 |
| 2021 | $589 | $76,260 | $24,160 | $52,100 |
| 2020 | $574 | $76,260 | $24,160 | $52,100 |
| 2019 | $574 | $76,260 | $24,160 | $52,100 |
| 2018 | $589 | $76,280 | $16,660 | $59,620 |
| 2016 | $589 | $76,284 | $16,660 | $59,624 |
| 2015 | $576 | $76,284 | $16,810 | $59,474 |
| 2014 | -- | $76,284 | $16,810 | $59,474 |
Source: Public Records
Map
Nearby Homes
- 2110 Newell St
- 2050 Welborn Cir
- 5713 Us Highway 64 E
- 1001 Meadowood Dr
- 321 Coleridge Rd
- 545 Coleridge Rd
- 715 Liberty St
- 507 Columbia Ave
- 4650 Huntingwood Rd
- 518 E Main St
- 5182 Foushee Rd
- 4659 Huntingwood Rd
- 4737 Huntingwood Rd
- 324 Elam Ave
- 0 State Highway 49
- 4319 Young Rd
- 309 Elam Ave
- 7187 Jordan Rd
- 3302 Fox Glow Trail
- 3315 Fox Glow Trail
- 995 Brooklyn Avenue Extension
- 1029 Brooklyn Avenue Extension
- 1004 Brooklyn Avenue Extension
- 1018 Brooklyn Avenue Extension
- 971 Brooklyn Avenue Extension
- 1004 Brooklyn Extension
- 1091 Brooklyn Avenue Extension
- 974 Brooklyn Avenue Extension
- 1072 Brooklyn Avenue Extension
- 969 Brooklyn Avenue Extension
- 966 Brooklyn Avenue Extension
- 1089 Brooklyn Avenue Extension
- 949 Brooklyn Avenue Extension
- 1095 Brooklyn Avenue Extension
- 937 Brooklyn Avenue Extension
- 937 Brooklyn Avenue Extension
- 930 Brooklyn Avenue Extension
- 928 Brooklyn Avenue Extension
- 919 Brooklyn Avenue Extension
- 912 Brooklyn Avenue Extension