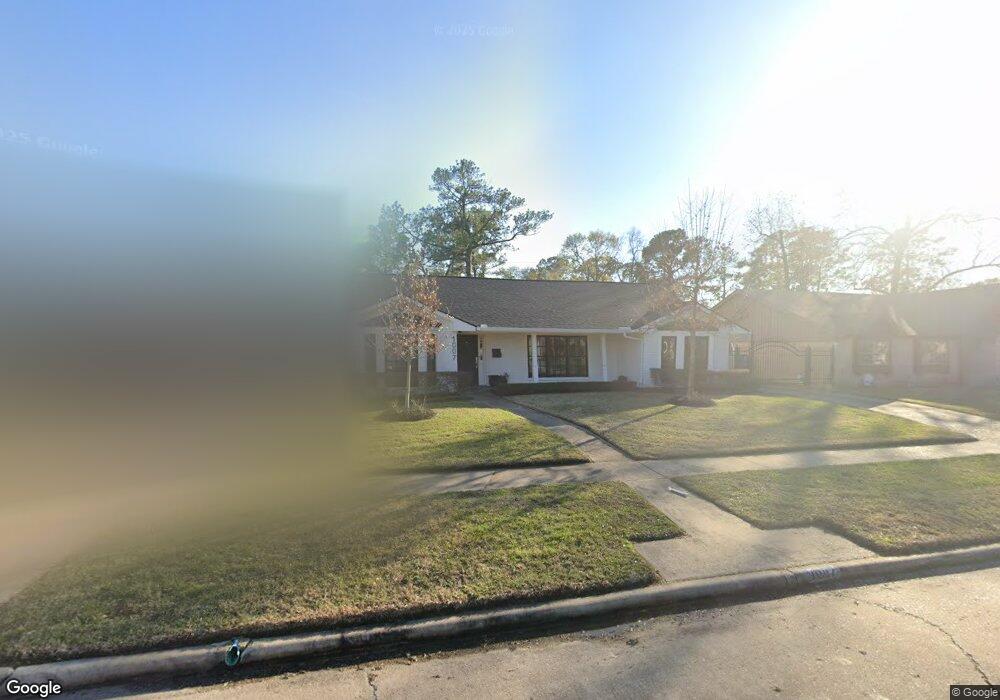
1007 Cheshire Ln Houston, TX 77018
Oak Forest-Garden Oaks NeighborhoodEstimated Value: $741,000 - $913,396
3
Beds
2
Baths
2,667
Sq Ft
$315/Sq Ft
Est. Value
About This Home
This home is located at 1007 Cheshire Ln, Houston, TX 77018 and is currently estimated at $839,099, approximately $314 per square foot. 1007 Cheshire Ln is a home located in Harris County with nearby schools including Durham Elementary School, Frank Black Middle School, and Waltrip High School.
Ownership History
Date
Name
Owned For
Owner Type
Purchase Details
Closed on
Aug 8, 2018
Sold by
Sliva Michael and Silva Elisabeth
Bought by
Doughty Clinton Neil and Doughty Adrien Michelle
Current Estimated Value
Home Financials for this Owner
Home Financials are based on the most recent Mortgage that was taken out on this home.
Original Mortgage
$453,100
Outstanding Balance
$392,679
Interest Rate
4.5%
Mortgage Type
New Conventional
Estimated Equity
$446,420
Purchase Details
Closed on
Apr 6, 2017
Sold by
Moore Frances
Bought by
Silva Michael and Silva Elisabeth
Home Financials for this Owner
Home Financials are based on the most recent Mortgage that was taken out on this home.
Original Mortgage
$424,100
Interest Rate
4.1%
Mortgage Type
New Conventional
Purchase Details
Closed on
Nov 3, 2010
Sold by
Snapp Elaine C and Snapp Elaine Clements
Bought by
Moore Frances
Create a Home Valuation Report for This Property
The Home Valuation Report is an in-depth analysis detailing your home's value as well as a comparison with similar homes in the area
Home Values in the Area
Average Home Value in this Area
Purchase History
| Date | Buyer | Sale Price | Title Company |
|---|---|---|---|
| Doughty Clinton Neil | -- | None Available | |
| Silva Michael | -- | None Available | |
| Moore Frances | -- | Old Republic National Title |
Source: Public Records
Mortgage History
| Date | Status | Borrower | Loan Amount |
|---|---|---|---|
| Open | Doughty Clinton Neil | $453,100 | |
| Previous Owner | Silva Michael | $424,100 |
Source: Public Records
Tax History Compared to Growth
Tax History
| Year | Tax Paid | Tax Assessment Tax Assessment Total Assessment is a certain percentage of the fair market value that is determined by local assessors to be the total taxable value of land and additions on the property. | Land | Improvement |
|---|---|---|---|---|
| 2025 | $14,773 | $880,000 | $336,000 | $544,000 |
| 2024 | $14,773 | $936,800 | $336,000 | $600,800 |
| 2023 | $14,773 | $848,000 | $302,400 | $545,600 |
| 2022 | $17,087 | $776,000 | $302,400 | $473,600 |
| 2021 | $16,724 | $717,562 | $302,400 | $415,162 |
| 2020 | $16,595 | $696,832 | $252,000 | $444,832 |
| 2019 | $15,765 | $623,000 | $252,000 | $371,000 |
| 2018 | $10,816 | $546,500 | $252,000 | $294,500 |
| 2017 | $9,750 | $465,394 | $252,000 | $213,394 |
| 2016 | $8,864 | $465,394 | $252,000 | $213,394 |
| 2015 | $2,595 | $428,794 | $252,000 | $176,794 |
| 2014 | $2,595 | $376,884 | $210,000 | $166,884 |
Source: Public Records
Map
Nearby Homes
- 4762 Martin St
- 4742 Martin St
- 1029 Martin St
- 991 Curtin St
- 1012 Candlelight Ln
- 1037 Cheshire Ln
- 4854 Brinkman St
- 1067 Curtin St
- 910 1/2 Oak St
- 4510 Curtin Park Ct
- 808 Woodcrest Dr Unit A
- 913 Lehman St
- 911 Lehman St
- 817 Thornton Rd Unit G
- 817 Thornton Rd Unit F
- 810 Martin St
- 807 Martin St Unit D
- 807 Martin St Unit C
- 812 Thornton Rd Unit B
- 934 W 43rd St
- 1009 Cheshire Ln
- 1005 Cheshire Ln
- 1010 Chantilly Ln
- 1011 Cheshire Ln
- 1006 Chantilly Ln
- 1014 Chantilly Ln
- 1003 Cheshire Ln
- 1008 Cheshire Ln
- 1002 Chantilly Ln
- 1006 Cheshire Ln
- 1010 Cheshire Ln
- 1018 Chantilly Ln
- 1013 Cheshire Ln
- 1004 Cheshire Ln
- 1012 Cheshire Ln
- 1022 Chantilly Ln
- 4618 Chantilly Cir
- 1014 Cheshire Ln
- 1002 Cheshire Ln
- 4619 Dunsmere St