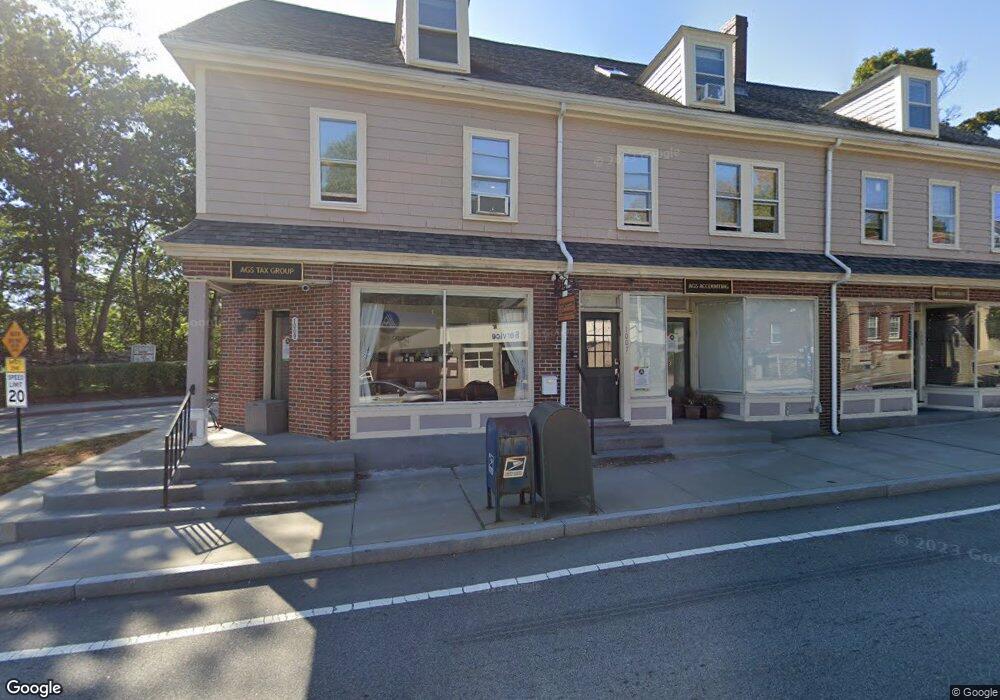
1007 Chestnut St Unit A Newton Upper Falls, MA 02464
Newton Upper Falls NeighborhoodEstimated Value: $592,100
20
Beds
1
Bath
656
Sq Ft
$903/Sq Ft
Est. Value
About This Home
This home is located at 1007 Chestnut St Unit A, Newton Upper Falls, MA 02464 and is currently estimated at $592,100, approximately $902 per square foot. 1007 Chestnut St Unit A is a home located in Middlesex County with nearby schools including Angier Elementary School, Zervas Elementary School, and Charles E Brown Middle School.
Ownership History
Date
Name
Owned For
Owner Type
Purchase Details
Closed on
Jun 16, 2011
Sold by
Sahagian Christopher M
Bought by
Eastern Gage Llc
Current Estimated Value
Home Financials for this Owner
Home Financials are based on the most recent Mortgage that was taken out on this home.
Original Mortgage
$187,500
Outstanding Balance
$129,924
Interest Rate
4.74%
Mortgage Type
Commercial
Estimated Equity
$462,176
Purchase Details
Closed on
Nov 29, 2002
Sold by
Mountain Brook Rt
Bought by
Sahagian Christopher
Purchase Details
Closed on
Jun 21, 1996
Sold by
Lavin Mary E
Bought by
Mountain Brook Rt
Home Financials for this Owner
Home Financials are based on the most recent Mortgage that was taken out on this home.
Original Mortgage
$30,000
Interest Rate
8.21%
Mortgage Type
Commercial
Purchase Details
Closed on
Jan 17, 1989
Sold by
Chestnut St Rt
Bought by
Lavin Philip T
Create a Home Valuation Report for This Property
The Home Valuation Report is an in-depth analysis detailing your home's value as well as a comparison with similar homes in the area
Home Values in the Area
Average Home Value in this Area
Purchase History
| Date | Buyer | Sale Price | Title Company |
|---|---|---|---|
| Eastern Gage Llc | $250,000 | -- | |
| Sahagian Christopher | $59,000 | -- | |
| Mountain Brook Rt | $60,000 | -- | |
| Lavin Philip T | $250,000 | -- |
Source: Public Records
Mortgage History
| Date | Status | Borrower | Loan Amount |
|---|---|---|---|
| Open | Eastern Gage Llc | $187,500 | |
| Previous Owner | Lavin Philip T | $30,000 |
Source: Public Records
Tax History Compared to Growth
Tax History
| Year | Tax Paid | Tax Assessment Tax Assessment Total Assessment is a certain percentage of the fair market value that is determined by local assessors to be the total taxable value of land and additions on the property. | Land | Improvement |
|---|---|---|---|---|
| 2025 | $2,043 | $111,400 | $0 | $111,400 |
| 2024 | $2,042 | $111,400 | $0 | $111,400 |
| 2023 | $2,237 | $117,300 | $0 | $117,300 |
| 2022 | $2,240 | $112,300 | $0 | $112,300 |
| 2021 | $2,259 | $112,300 | $0 | $112,300 |
| 2020 | $2,169 | $108,900 | $0 | $108,900 |
| 2019 | $1,836 | $92,100 | $0 | $92,100 |
| 2018 | $1,761 | $85,400 | $0 | $85,400 |
| 2017 | $1,727 | $81,200 | $0 | $81,200 |
| 2016 | $1,782 | $81,200 | $0 | $81,200 |
| 2015 | $1,817 | $81,200 | $0 | $81,200 |
Source: Public Records
Map
Nearby Homes
- 992 Chestnut St
- 989 Chestnut St Unit 8
- 66 Rockland Place
- 51 Pettee St Unit 11
- 27 Hamilton Place
- 45 River Ave Unit 45
- 304 Elliot St Carriage House S Unit 4
- 103 Thurston Rd
- 302 Elliot St Carriage House N Unit 3
- 300 Elliot St Unit 300
- 102 Thurston Rd Unit 100
- 873 Chestnut St
- 20 Pennsylvania Ave
- 20 Pennsylvania Ave Unit 20
- 18-20 Pennsylvania Ave Unit 18
- 27 Indiana Terrace Unit 29
- 54 Indiana Terrace
- 12 Shawmut Park
- 131 Oliver Rd
- 187 Saint Mary St
- 1007 Chestnut St Unit C
- 1005 Chestnut St Unit 1stFlRetail
- 1005 Chestnut St Unit Retail
- 1005 Chestnut St
- 1009 Chestnut St Unit A
- 1009 Chestnut St Unit B
- 999 Chestnut St
- 999 Chestnut St Unit 1
- 1000 Chestnut St Unit 5,1000
- 1000 Chestnut St Unit B
- 1000 Chestnut St
- 1000 Chestnut St Unit 1100
- 1000 Chestnut St Unit 1000
- 1010 Chestnut St
- 997 Chestnut St Unit 997
- 997 Chestnut St Unit 997-9
- 993-997 Chestnut St Unit 1
- 997 Chestnut St Unit 1
- 995 Chestnut St Unit 1
- 997 Chestnut St Unit 9