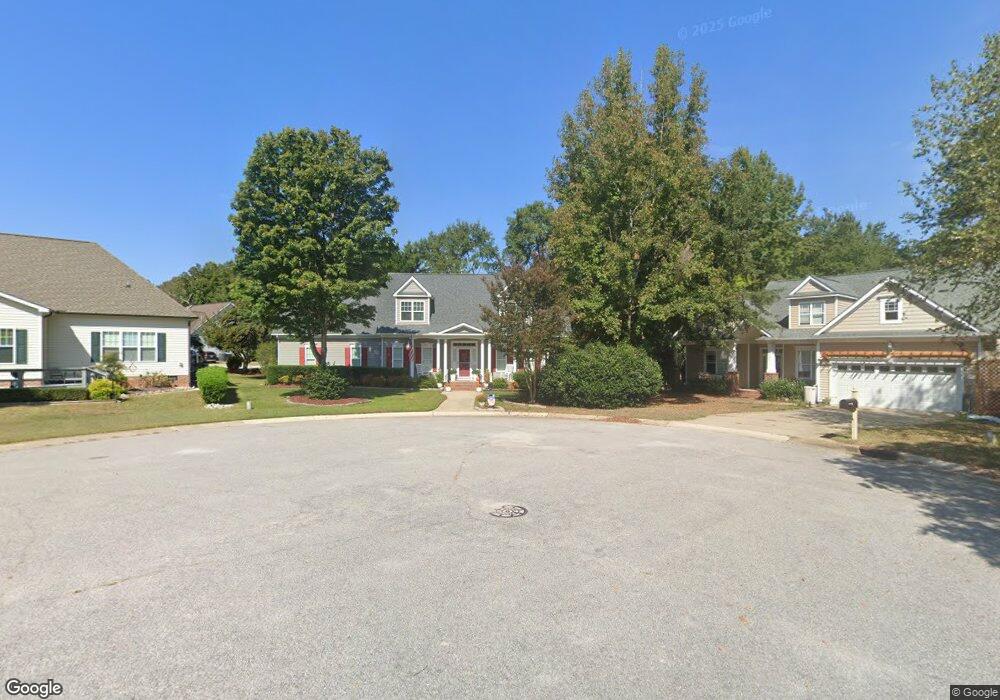
1007 E Ivy Valley Dr Fuquay Varina, NC 27526
Estimated Value: $450,414 - $491,000
3
Beds
3
Baths
2,288
Sq Ft
$203/Sq Ft
Est. Value
About This Home
This home is located at 1007 E Ivy Valley Dr, Fuquay Varina, NC 27526 and is currently estimated at $464,854, approximately $203 per square foot. 1007 E Ivy Valley Dr is a home located in Wake County with nearby schools including Fuquay-Varina High and Southern Wake Academy.
Ownership History
Date
Name
Owned For
Owner Type
Purchase Details
Closed on
Jul 13, 2018
Sold by
Brooker William R and Brooker Regina L
Bought by
Maski Phillip E and Maski Diane S
Current Estimated Value
Purchase Details
Closed on
Aug 27, 2008
Sold by
Cornerstone Residential Builders Inc
Bought by
Brooker William R and Brooker Regina L
Home Financials for this Owner
Home Financials are based on the most recent Mortgage that was taken out on this home.
Original Mortgage
$115,800
Interest Rate
6.21%
Mortgage Type
Purchase Money Mortgage
Purchase Details
Closed on
Nov 16, 2006
Sold by
Robert J Sullivan Builder Inc
Bought by
Cornerstone Residential Builders Inc
Home Financials for this Owner
Home Financials are based on the most recent Mortgage that was taken out on this home.
Original Mortgage
$33,600
Interest Rate
6.25%
Mortgage Type
Purchase Money Mortgage
Create a Home Valuation Report for This Property
The Home Valuation Report is an in-depth analysis detailing your home's value as well as a comparison with similar homes in the area
Home Values in the Area
Average Home Value in this Area
Purchase History
| Date | Buyer | Sale Price | Title Company |
|---|---|---|---|
| Maski Phillip E | $278,000 | None Available | |
| Brooker William R | $266,500 | None Available | |
| Cornerstone Residential Builders Inc | $42,000 | None Available |
Source: Public Records
Mortgage History
| Date | Status | Borrower | Loan Amount |
|---|---|---|---|
| Previous Owner | Brooker William R | $115,800 | |
| Previous Owner | Cornerstone Residential Builders Inc | $33,600 |
Source: Public Records
Tax History
| Year | Tax Paid | Tax Assessment Tax Assessment Total Assessment is a certain percentage of the fair market value that is determined by local assessors to be the total taxable value of land and additions on the property. | Land | Improvement |
|---|---|---|---|---|
| 2025 | $4,019 | $456,979 | $85,000 | $371,979 |
| 2024 | $4,003 | $456,979 | $85,000 | $371,979 |
| 2023 | $3,477 | $310,876 | $55,000 | $255,876 |
| 2022 | $3,267 | $310,876 | $55,000 | $255,876 |
| 2021 | $3,113 | $310,876 | $55,000 | $255,876 |
| 2020 | $3,113 | $310,876 | $55,000 | $255,876 |
| 2019 | $2,948 | $253,918 | $52,000 | $201,918 |
| 2018 | $0 | $253,918 | $52,000 | $201,918 |
| 2017 | $2,680 | $253,918 | $52,000 | $201,918 |
| 2016 | $2,643 | $253,918 | $52,000 | $201,918 |
| 2015 | $2,754 | $273,543 | $44,000 | $229,543 |
| 2014 | $2,654 | $273,543 | $44,000 | $229,543 |
Source: Public Records
Map
Nearby Homes
- 1053 Lukestone Dr
- 835 Brookhannah Ct
- 825 Brookhannah Ct
- 729 E Ivy Valley Dr
- 7117 Sunset Lake Rd
- 2117 Crockett Ridge Rd
- 0 E Cardinal Dr
- 820 E Cardinal Dr
- 764 Cabin Branch Dr
- 2108 Woodwater Dr
- 718 E Azalea Ct
- 2241 Stewart St
- 7221 Sunset Lake Rd
- 2204 Gathering Square Ct
- 2202 Gathering Square Ct
- 2314 Gathering Square Ct
- 2418 Gathering Square Ct
- 2425 Gathering Square Ct
- 2208 Gathering Square Ct
- 2217 Gathering Square Ct
- 1806 Shellview Dr
- 1800 Shellview Dr
- 1011 E Ivy Valley Dr
- 1810 Shellview Dr
- 933 E Ivy Valley Dr
- 1015 E Ivy Valley Dr
- 1019 E Ivy Valley Dr
- 1814 Shellview Dr
- 1027 Sethcreek Dr
- 1000 E Ivy Valley Dr
- 929 E Ivy Valley Dr Unit 94
- 932 E Ivy Valley Dr
- 1028 Sethcreek Dr
- 1818 Shellview Dr
- 1018 E Ivy Valley Dr
- 1815 Shellview Dr
- 1015 Sethcreek Dr
- 928 E Ivy Valley Dr
- 1024 Sethcreek Dr
- 1822 Shellview Dr
Your Personal Tour Guide
Ask me questions while you tour the home.