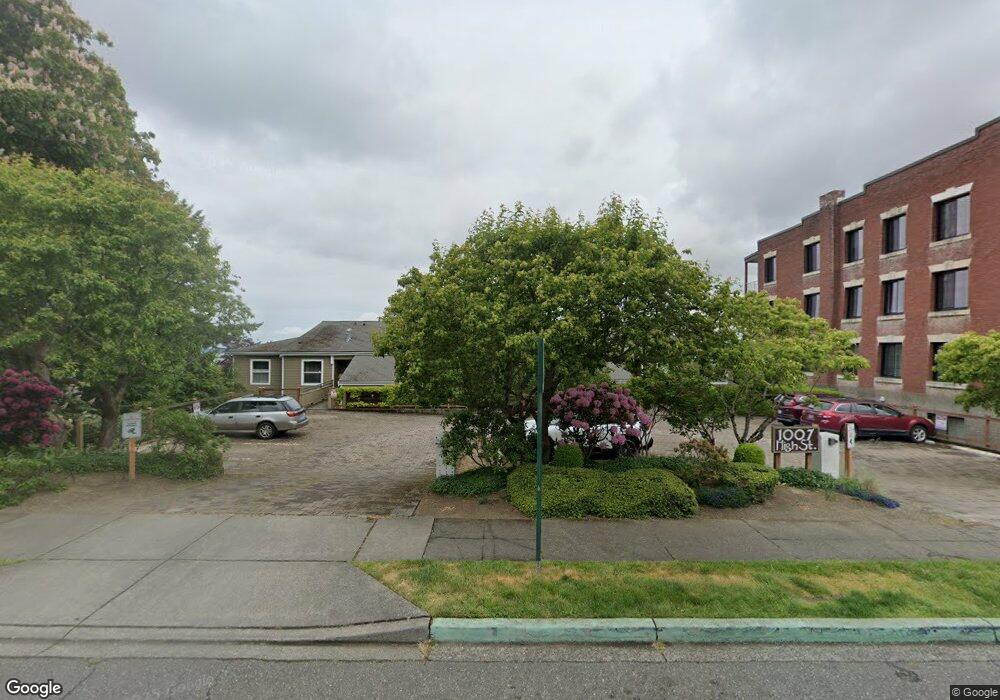
1007 High St Unit 104 Bellingham, WA 98225
Sehome NeighborhoodEstimated Value: $532,000 - $641,000
2
Beds
2
Baths
1,261
Sq Ft
$464/Sq Ft
Est. Value
About This Home
This home is located at 1007 High St Unit 104, Bellingham, WA 98225 and is currently estimated at $585,173, approximately $464 per square foot. 1007 High St Unit 104 is a home located in Whatcom County with nearby schools including Lowell Elementary School, Fairhaven Middle School, and Sehome High School.
Ownership History
Date
Name
Owned For
Owner Type
Purchase Details
Closed on
Oct 6, 2008
Sold by
Dillion Tommie D and Dillion Linda S
Bought by
Webster Robert C and Webster Elisabeth C
Current Estimated Value
Home Financials for this Owner
Home Financials are based on the most recent Mortgage that was taken out on this home.
Original Mortgage
$176,250
Outstanding Balance
$116,977
Interest Rate
6.39%
Mortgage Type
Purchase Money Mortgage
Estimated Equity
$468,196
Purchase Details
Closed on
Aug 18, 2003
Sold by
Convexo Llc
Bought by
Dillion Tommie D and Dillion Linda S
Home Financials for this Owner
Home Financials are based on the most recent Mortgage that was taken out on this home.
Original Mortgage
$103,140
Interest Rate
5.62%
Mortgage Type
Purchase Money Mortgage
Create a Home Valuation Report for This Property
The Home Valuation Report is an in-depth analysis detailing your home's value as well as a comparison with similar homes in the area
Home Values in the Area
Average Home Value in this Area
Purchase History
| Date | Buyer | Sale Price | Title Company |
|---|---|---|---|
| Webster Robert C | $235,280 | Stewart Title Company | |
| Dillion Tommie D | $171,900 | Whatcom Land Title |
Source: Public Records
Mortgage History
| Date | Status | Borrower | Loan Amount |
|---|---|---|---|
| Open | Webster Robert C | $176,250 | |
| Previous Owner | Dillion Tommie D | $103,140 |
Source: Public Records
Tax History Compared to Growth
Tax History
| Year | Tax Paid | Tax Assessment Tax Assessment Total Assessment is a certain percentage of the fair market value that is determined by local assessors to be the total taxable value of land and additions on the property. | Land | Improvement |
|---|---|---|---|---|
| 2024 | $4,276 | $549,336 | $75,200 | $474,136 |
| 2023 | $4,276 | $549,336 | $75,200 | $474,136 |
| 2022 | $3,732 | $454,006 | $62,150 | $391,856 |
| 2021 | $3,595 | $401,775 | $55,000 | $346,775 |
| 2020 | $3,569 | $365,250 | $50,000 | $315,250 |
| 2019 | $2,943 | $350,481 | $83,912 | $266,569 |
| 2018 | $3,261 | $289,776 | $69,378 | $220,398 |
| 2017 | $2,700 | $274,503 | $65,702 | $208,801 |
| 2016 | $2,426 | $237,581 | $56,862 | $180,719 |
| 2015 | $2,451 | $222,212 | $53,222 | $168,990 |
| 2014 | -- | $217,191 | $52,000 | $165,191 |
| 2013 | -- | $218,301 | $52,200 | $166,101 |
Source: Public Records
Map
Nearby Homes
- 615 E Myrtle St
- 1126 N Forest St
- 1001 N State St Unit 403
- 1031 N State St Unit 107
- 1031 N State St Unit 209
- 901 N Forest St Unit 107
- 901 N Forest St Unit 125
- 901 N Forest St Unit 109
- 616 E Myrtle St
- 1015 Railroad Ave Unit 418
- 310 E Ivy St
- 1309 Billy Frank Jr St
- 1234 Grant St
- 1205 E Maple St
- 5 XX Gladstone St
- 1335 Humboldt St
- 0 Pine St Unit NWM2445229
- 1125 Otis St
- 1025 Granary Ave Unit 503
- 1025 Granary Ave Unit 404
- 1007 High St
- 1007 High St Unit 304
- 1007 High St Unit 303
- 1007 High St Unit 302
- 1007 High St Unit 301
- 1007 High St Unit 204
- 1007 High St Unit 203
- 1007 High St Unit 202
- 1007 High St Unit 201
- 1007 High St Unit 103
- 1007 High St Unit 102
- 1007 High St Unit 101
- 1007 High St Unit 304
- 1011 High St
- 1000 N Garden St
- 1000 N Garden St Unit B201
- 1000 N Garden St Unit B101
- 1000 N Garden St Unit 201
- 1000 N Garden St Unit 101
- 1000 N Garden St Unit A101