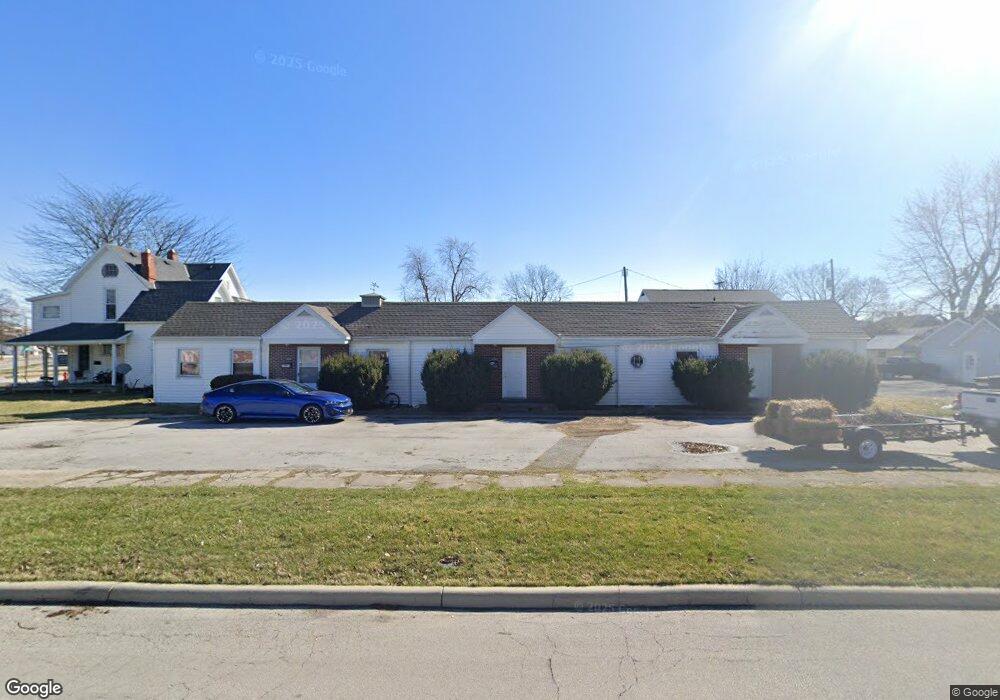
1007 Hurd Ave Unit 1011 Findlay, OH 45840
Estimated Value: $101,000 - $155,000
3
Beds
3
Baths
1,372
Sq Ft
$88/Sq Ft
Est. Value
About This Home
This home is located at 1007 Hurd Ave Unit 1011, Findlay, OH 45840 and is currently estimated at $120,333, approximately $87 per square foot. 1007 Hurd Ave Unit 1011 is a home located in Hancock County with nearby schools including Lincoln Elementary School, Donnell Middle School, and Findlay High School.
Ownership History
Date
Name
Owned For
Owner Type
Purchase Details
Closed on
May 1, 2008
Sold by
Blattner David A and Blattner Doris
Bought by
Oman Justin D and Oman John D
Current Estimated Value
Purchase Details
Closed on
Apr 11, 2008
Sold by
Fannie Mae
Bought by
Blattner David A
Purchase Details
Closed on
Nov 20, 2007
Sold by
Pickens Gina R
Bought by
Federal National Mortgage Association
Purchase Details
Closed on
Feb 4, 1987
Bought by
Hollosi Todd A
Purchase Details
Closed on
Apr 6, 1984
Bought by
Hollosi Todd A and Hollosi Karen L
Create a Home Valuation Report for This Property
The Home Valuation Report is an in-depth analysis detailing your home's value as well as a comparison with similar homes in the area
Home Values in the Area
Average Home Value in this Area
Purchase History
| Date | Buyer | Sale Price | Title Company |
|---|---|---|---|
| Oman Justin D | -- | Assured Title Agency Inc | |
| Blattner David A | $45,000 | Assured Title | |
| Federal National Mortgage Association | $41,667 | None Available | |
| Hollosi Todd A | -- | -- | |
| Hollosi Todd A | -- | -- |
Source: Public Records
Tax History Compared to Growth
Tax History
| Year | Tax Paid | Tax Assessment Tax Assessment Total Assessment is a certain percentage of the fair market value that is determined by local assessors to be the total taxable value of land and additions on the property. | Land | Improvement |
|---|---|---|---|---|
| 2024 | $927 | $25,420 | $7,070 | $18,350 |
| 2023 | $928 | $25,420 | $7,070 | $18,350 |
| 2022 | $925 | $25,420 | $7,070 | $18,350 |
| 2021 | $838 | $20,060 | $7,230 | $12,830 |
| 2020 | $838 | $20,060 | $7,230 | $12,830 |
| 2019 | $821 | $20,060 | $7,230 | $12,830 |
| 2018 | $736 | $16,440 | $5,090 | $11,350 |
| 2017 | $734 | $16,440 | $5,090 | $11,350 |
| 2016 | $736 | $16,440 | $5,090 | $11,350 |
| 2015 | $640 | $14,220 | $4,380 | $9,840 |
| 2014 | $640 | $14,220 | $4,380 | $9,840 |
| 2012 | $708 | $15,550 | $4,380 | $11,170 |
Source: Public Records
Map
Nearby Homes