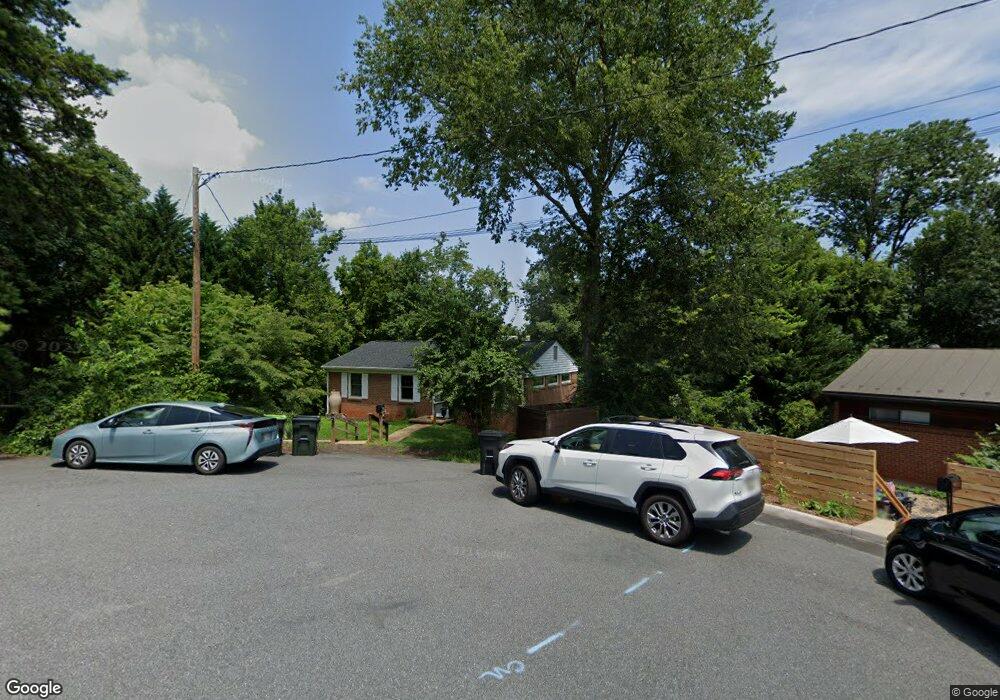
1007 Locust Ln Charlottesville, VA 22901
Locust Grove NeighborhoodEstimated Value: $920,000 - $1,120,194
3
Beds
3
Baths
2,446
Sq Ft
$427/Sq Ft
Est. Value
About This Home
This home is located at 1007 Locust Ln, Charlottesville, VA 22901 and is currently estimated at $1,044,299, approximately $426 per square foot. 1007 Locust Ln is a home located in Charlottesville City with nearby schools including Burnley-Moran Elementary School, Buford Middle School, and Charlottesville High School.
Ownership History
Date
Name
Owned For
Owner Type
Purchase Details
Closed on
Jul 17, 2019
Sold by
Berdel Richard L
Bought by
Converse Benjamin A and Trawalter Sophie
Current Estimated Value
Home Financials for this Owner
Home Financials are based on the most recent Mortgage that was taken out on this home.
Original Mortgage
$616,250
Outstanding Balance
$539,668
Interest Rate
3.8%
Mortgage Type
New Conventional
Estimated Equity
$504,631
Purchase Details
Closed on
Apr 12, 1999
Bought by
Berdel Richard and Mabel Kinzie-
Create a Home Valuation Report for This Property
The Home Valuation Report is an in-depth analysis detailing your home's value as well as a comparison with similar homes in the area
Home Values in the Area
Average Home Value in this Area
Purchase History
| Date | Buyer | Sale Price | Title Company |
|---|---|---|---|
| Converse Benjamin A | $725,000 | -- | |
| Berdel Richard | $29,000 | -- |
Source: Public Records
Mortgage History
| Date | Status | Borrower | Loan Amount |
|---|---|---|---|
| Open | Converse Benjamin A | $616,250 |
Source: Public Records
Tax History
| Year | Tax Paid | Tax Assessment Tax Assessment Total Assessment is a certain percentage of the fair market value that is determined by local assessors to be the total taxable value of land and additions on the property. | Land | Improvement |
|---|---|---|---|---|
| 2025 | $10,464 | $1,044,200 | $240,900 | $803,300 |
| 2024 | $10,464 | $1,008,300 | $217,400 | $790,900 |
| 2023 | $9,341 | $949,000 | $217,400 | $731,600 |
| 2022 | $8,553 | $866,900 | $177,900 | $689,000 |
| 2021 | $7,367 | $751,200 | $153,900 | $597,300 |
| 2020 | $7,073 | $720,300 | $153,900 | $566,400 |
| 2019 | $7,201 | $475,100 | $139,900 | $335,200 |
| 2018 | $2,239 | $447,100 | $111,900 | $335,200 |
| 2017 | $4,339 | $432,500 | $97,300 | $335,200 |
| 2016 | $4,116 | $409,000 | $97,300 | $311,700 |
| 2015 | $4,226 | $392,800 | $81,100 | $311,700 |
| 2014 | $4,226 | $407,100 | $95,400 | $311,700 |
Source: Public Records
Map
Nearby Homes
- 1334 Pen Park Ln
- 1204 Holmes Ave
- Lot 142 Lochlyn Hill Dr
- 508 Bennett St
- 448 Nicholson St
- 444 Nicholson St
- 412 Nicholson St
- 575 Lochlyn Hill Dr
- 675 Lochlyn Hill Dr
- Lot 148 Pen Park Ln
- 1018 Glendale Rd
- 1004 Coleman St
- 528 Trailside Dr
- Lot A Saint Charles Ave
- 1002 Glendale Rd
- 638 Crumpet Ct
- 1213 Cutler Ln
- 722 Exton Ct
- 1169 Pen Park Rd
- 1640 Delphi Dr
Your Personal Tour Guide
Ask me questions while you tour the home.