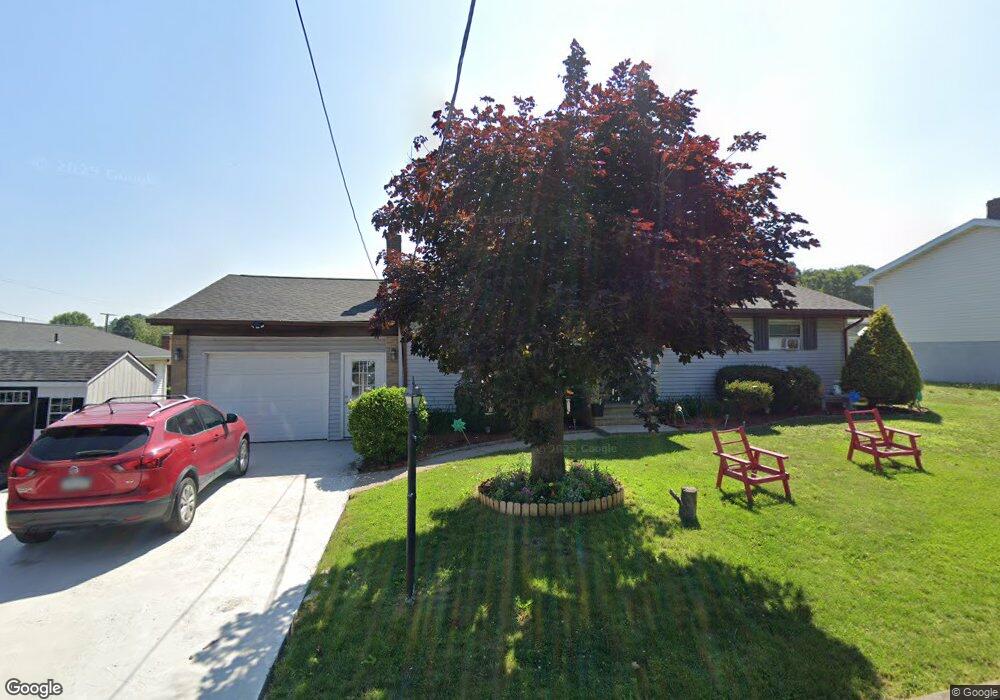
1007 N Manhattan Ct Hazleton, PA 18201
Estimated Value: $233,000 - $286,000
3
Beds
2
Baths
1,100
Sq Ft
$240/Sq Ft
Est. Value
About This Home
This home is located at 1007 N Manhattan Ct, Hazleton, PA 18201 and is currently estimated at $263,613, approximately $239 per square foot. 1007 N Manhattan Ct is a home located in Luzerne County with nearby schools including Hazleton Area High School, Immanuel Christian School, and Holy Family Academy.
Ownership History
Date
Name
Owned For
Owner Type
Purchase Details
Closed on
Feb 1, 2022
Sold by
Durange David J
Bought by
Camacho Maria Altagracia R
Current Estimated Value
Home Financials for this Owner
Home Financials are based on the most recent Mortgage that was taken out on this home.
Original Mortgage
$216,015
Outstanding Balance
$200,342
Interest Rate
3.45%
Mortgage Type
FHA
Estimated Equity
$63,271
Purchase Details
Closed on
Sep 11, 2014
Sold by
Rupert Kimberly A
Bought by
Durange David J
Purchase Details
Closed on
Oct 18, 2010
Sold by
Urban Debra Ann and Phillips Debra Ann
Bought by
Rupert Kimberly A and Durange David J
Home Financials for this Owner
Home Financials are based on the most recent Mortgage that was taken out on this home.
Original Mortgage
$115,440
Interest Rate
4.5%
Mortgage Type
FHA
Create a Home Valuation Report for This Property
The Home Valuation Report is an in-depth analysis detailing your home's value as well as a comparison with similar homes in the area
Home Values in the Area
Average Home Value in this Area
Purchase History
| Date | Buyer | Sale Price | Title Company |
|---|---|---|---|
| Camacho Maria Altagracia R | $220,000 | None Listed On Document | |
| Durange David J | -- | None Available | |
| Rupert Kimberly A | $117,000 | None Available |
Source: Public Records
Mortgage History
| Date | Status | Borrower | Loan Amount |
|---|---|---|---|
| Open | Camacho Maria Altagracia R | $216,015 | |
| Previous Owner | Rupert Kimberly A | $115,440 |
Source: Public Records
Tax History Compared to Growth
Tax History
| Year | Tax Paid | Tax Assessment Tax Assessment Total Assessment is a certain percentage of the fair market value that is determined by local assessors to be the total taxable value of land and additions on the property. | Land | Improvement |
|---|---|---|---|---|
| 2025 | $2,758 | $96,000 | $23,700 | $72,300 |
| 2024 | $2,583 | $96,000 | $23,700 | $72,300 |
| 2023 | $2,415 | $96,000 | $23,700 | $72,300 |
| 2022 | $2,398 | $96,000 | $23,700 | $72,300 |
| 2021 | $2,342 | $96,000 | $23,700 | $72,300 |
| 2020 | $2,093 | $96,000 | $23,700 | $72,300 |
| 2019 | $2,159 | $96,000 | $23,700 | $72,300 |
| 2018 | $2,086 | $96,000 | $23,700 | $72,300 |
| 2017 | $1,923 | $96,000 | $23,700 | $72,300 |
| 2016 | $982 | $96,000 | $23,700 | $72,300 |
| 2015 | -- | $96,000 | $23,700 | $72,300 |
| 2014 | -- | $96,000 | $23,700 | $72,300 |
Source: Public Records
Map
Nearby Homes
- 991 Seybert St
- 837 N Laurel St
- 827 N Vine St
- 19 W 14th St
- 756 Seybert St
- 738 N Manhattan Ct
- 739 N Church St
- 882 N Locust St
- 1009 Peace St
- 714 Alter St
- 782 N James St
- 14 W 5th St
- 756 Peace St
- 629 Arthur St
- 572 N Vine St
- 589 Garfield St
- 538 Carson St Unit 40
- 530 N Lee Ct
- 523 N Laurel St
- 127 W Diamond Ave
- 1003 N Manhattan Ct
- 1002 N Wyoming St
- 1000 N Wyoming St
- 2 W 22nd St
- 996 N Wyoming St
- 50 W 22nd St
- 999 N Laurel St
- 56 W 22nd St
- 991 N Manhattan Ct
- 27 W 22nd St
- 35 W 22nd St
- 987 N Laurel St
- 45 W 22nd St
- 990 N Wyoming St
- 10 E 22nd St
- 55 W 22nd St
- 55 W 22nd St
- 1003 N Wyoming St
- 63 W 22nd St
- 1025 N Laurel St