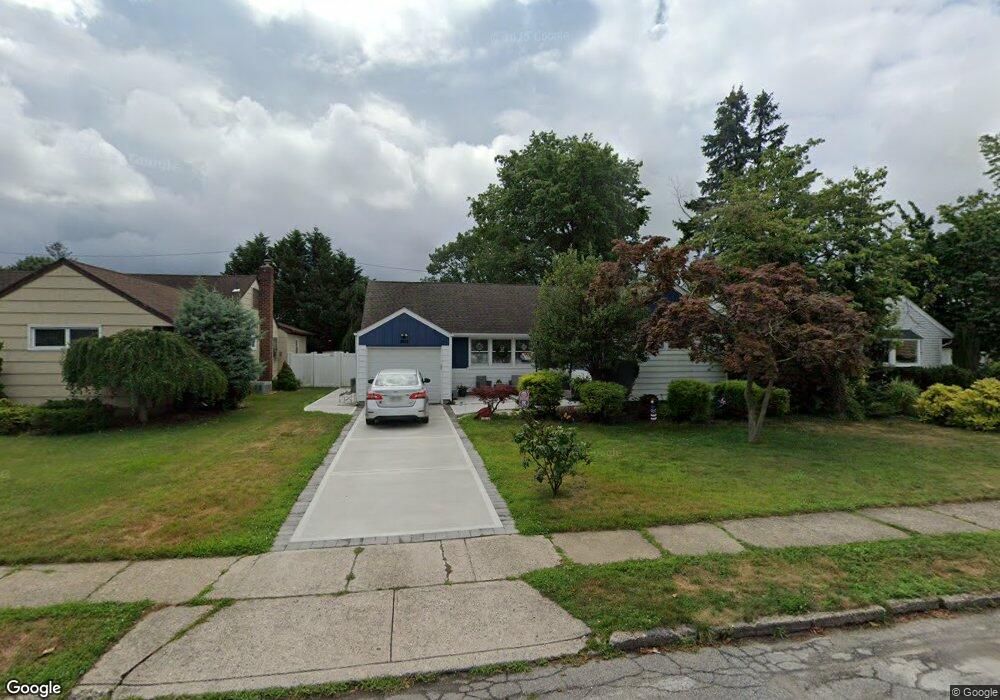
1007 Olympia Rd North Bellmore, NY 11710
Estimated Value: $727,000 - $797,923
3
Beds
2
Baths
1,574
Sq Ft
$484/Sq Ft
Est. Value
About This Home
This home is located at 1007 Olympia Rd, North Bellmore, NY 11710 and is currently estimated at $762,462, approximately $484 per square foot. 1007 Olympia Rd is a home located in Nassau County with nearby schools including Weatherford West Elementary School, Lt. General Thomas P. Stafford Elementary School, and Grand Avenue Middle School.
Ownership History
Date
Name
Owned For
Owner Type
Purchase Details
Closed on
Jan 2, 2018
Sold by
Cerqueira Mario D and Cerqueira Amanda M
Bought by
Verity Caitlin and Verity Matthew
Current Estimated Value
Home Financials for this Owner
Home Financials are based on the most recent Mortgage that was taken out on this home.
Original Mortgage
$427,500
Outstanding Balance
$360,759
Interest Rate
3.94%
Mortgage Type
New Conventional
Estimated Equity
$401,703
Purchase Details
Closed on
Feb 26, 2016
Sold by
Veneziano Charles and Veneziano Phillip
Bought by
Cerqueira Mario D and Cerqueira Mario B
Home Financials for this Owner
Home Financials are based on the most recent Mortgage that was taken out on this home.
Original Mortgage
$351,000
Interest Rate
3.79%
Mortgage Type
New Conventional
Purchase Details
Closed on
May 30, 2006
Sold by
Blohm Edgar
Bought by
Veneziano Charles
Purchase Details
Closed on
May 14, 1997
Create a Home Valuation Report for This Property
The Home Valuation Report is an in-depth analysis detailing your home's value as well as a comparison with similar homes in the area
Home Values in the Area
Average Home Value in this Area
Purchase History
| Date | Buyer | Sale Price | Title Company |
|---|---|---|---|
| Verity Caitlin | $475,000 | -- | |
| Cerqueira Mario D | $390,000 | None Available | |
| Veneziano Charles | $460,000 | -- | |
| -- | -- | -- |
Source: Public Records
Mortgage History
| Date | Status | Borrower | Loan Amount |
|---|---|---|---|
| Open | Verity Caitlin | $427,500 | |
| Previous Owner | Cerqueira Mario D | $351,000 |
Source: Public Records
Tax History Compared to Growth
Tax History
| Year | Tax Paid | Tax Assessment Tax Assessment Total Assessment is a certain percentage of the fair market value that is determined by local assessors to be the total taxable value of land and additions on the property. | Land | Improvement |
|---|---|---|---|---|
| 2025 | $13,545 | $476 | $183 | $293 |
| 2024 | $3,524 | $499 | $192 | $307 |
| 2023 | $12,974 | $520 | $200 | $320 |
| 2022 | $12,974 | $503 | $200 | $303 |
| 2021 | $16,118 | $475 | $170 | $305 |
| 2020 | $10,488 | $655 | $568 | $87 |
| 2019 | $2,784 | $585 | $479 | $106 |
| 2018 | $7,281 | $624 | $0 | $0 |
| 2017 | $7,987 | $735 | $509 | $226 |
| 2016 | $11,265 | $778 | $538 | $240 |
| 2015 | $3,597 | $870 | $602 | $268 |
| 2014 | $3,597 | $870 | $602 | $268 |
| 2013 | $3,375 | $870 | $602 | $268 |
Source: Public Records
Map
Nearby Homes
- 930 W Shelley Rd
- 886 Bellmore Ave
- 980 Siems Ct
- 2758 Mayfield Place
- 2548 Columbus Ave
- 985 Douglas Ave
- 899 Brent Dr
- 975 Little Neck Ave
- 2531 Jerusalem Ave Unit 2G
- 2794 Janet Ave
- 2846 Walter Rd
- 2477 Columbus Ave
- 2425 Sycamore Ln
- 736 Bellmore Rd
- 2166 Isabelle Ct
- 1253 Raymond Rd
- 1010 Brent Dr
- 2197 Jeffrey Dr
- 2906 Lawrence Dr
- 1078 Barbara Ct
- 1001 Olympia Rd
- 1022 Huckleberry Rd
- 995 Olympia Rd
- 1031 Olympia Rd
- 1028 Huckleberry Rd
- 1016 Huckleberry Rd
- 1006 Olympia Rd
- 1012 Olympia Rd
- 1000 Olympia Rd
- 1037 Olympia Rd
- 1016 Olympia Rd
- 1002 Huckleberry Rd
- 994 Olympia Rd
- 1020 Olympia Rd
- 1034 Huckleberry Rd
- 1026 Olympia Rd
- 988 Olympia Rd
- 1041 Olympia Rd
- 1032 Olympia Rd
- 1040 Huckleberry Rd