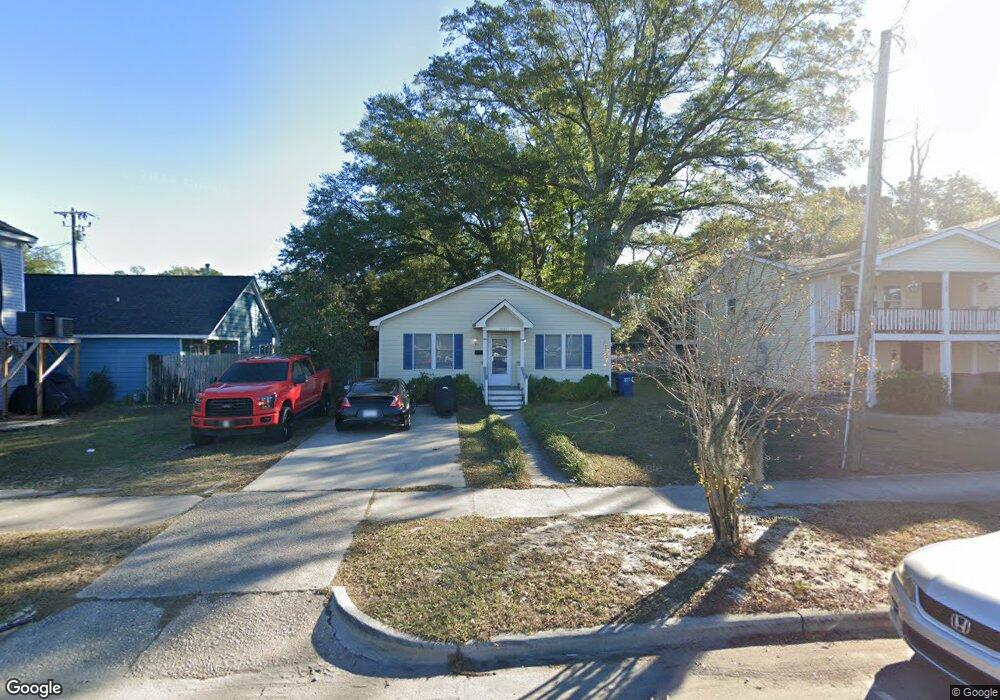
1007 S 3rd St Wilmington, NC 28401
Dry Pond-South Side NeighborhoodEstimated Value: $291,000 - $460,000
2
Beds
2
Baths
1,350
Sq Ft
$262/Sq Ft
Est. Value
About This Home
This home is located at 1007 S 3rd St, Wilmington, NC 28401 and is currently estimated at $354,319, approximately $262 per square foot. 1007 S 3rd St is a home located in New Hanover County with nearby schools including Snipes Academy of Arts & Design, Williston Middle School, and New Hanover High School.
Ownership History
Date
Name
Owned For
Owner Type
Purchase Details
Closed on
Apr 27, 2011
Sold by
Federal Home Loan Mortgage Corporation
Bought by
James Roderick and James Shirlene
Current Estimated Value
Home Financials for this Owner
Home Financials are based on the most recent Mortgage that was taken out on this home.
Original Mortgage
$44,000
Outstanding Balance
$28,937
Interest Rate
3.75%
Mortgage Type
New Conventional
Estimated Equity
$325,382
Purchase Details
Closed on
Dec 13, 2010
Sold by
Hands Betty E
Bought by
Federal Home Loan Mortgage Corp
Purchase Details
Closed on
May 3, 2002
Sold by
Hands Betty E
Bought by
Hands Betty E Heirs
Purchase Details
Closed on
Oct 3, 1997
Sold by
James Roderick L Shirlene N
Bought by
Hands Betty E
Purchase Details
Closed on
Jul 2, 1997
Sold by
Peterson Lillie J
Bought by
James Roderick L Shirlene N
Purchase Details
Closed on
Dec 23, 1992
Sold by
Peterson G H Lillie J
Bought by
Peterson Lillie J
Purchase Details
Closed on
Apr 1, 1977
Bought by
Peterson G H Lillie J
Create a Home Valuation Report for This Property
The Home Valuation Report is an in-depth analysis detailing your home's value as well as a comparison with similar homes in the area
Home Values in the Area
Average Home Value in this Area
Purchase History
| Date | Buyer | Sale Price | Title Company |
|---|---|---|---|
| James Roderick | -- | Chicago Title Insurance Co | |
| Federal Home Loan Mortgage Corp | $44,176 | None Available | |
| Hands Betty E Heirs | -- | -- | |
| Hands Betty E | $75,000 | -- | |
| James Roderick L Shirlene N | $3,000 | -- | |
| Peterson Lillie J | -- | -- | |
| Peterson G H Lillie J | -- | -- |
Source: Public Records
Mortgage History
| Date | Status | Borrower | Loan Amount |
|---|---|---|---|
| Open | James Roderick | $44,000 |
Source: Public Records
Tax History Compared to Growth
Tax History
| Year | Tax Paid | Tax Assessment Tax Assessment Total Assessment is a certain percentage of the fair market value that is determined by local assessors to be the total taxable value of land and additions on the property. | Land | Improvement |
|---|---|---|---|---|
| 2023 | $1,235 | $189,200 | $62,200 | $127,000 |
| 2022 | $1,608 | $189,200 | $62,200 | $127,000 |
| 2021 | $1,619 | $189,200 | $62,200 | $127,000 |
| 2020 | $1,065 | $101,100 | $35,600 | $65,500 |
| 2019 | $1,065 | $101,100 | $35,600 | $65,500 |
| 2018 | $1,065 | $101,100 | $35,600 | $65,500 |
| 2017 | $1,065 | $101,100 | $35,600 | $65,500 |
| 2016 | $1,572 | $141,900 | $41,000 | $100,900 |
| 2015 | $1,503 | $141,900 | $41,000 | $100,900 |
| 2014 | $1,439 | $141,900 | $41,000 | $100,900 |
Source: Public Records
Map
Nearby Homes