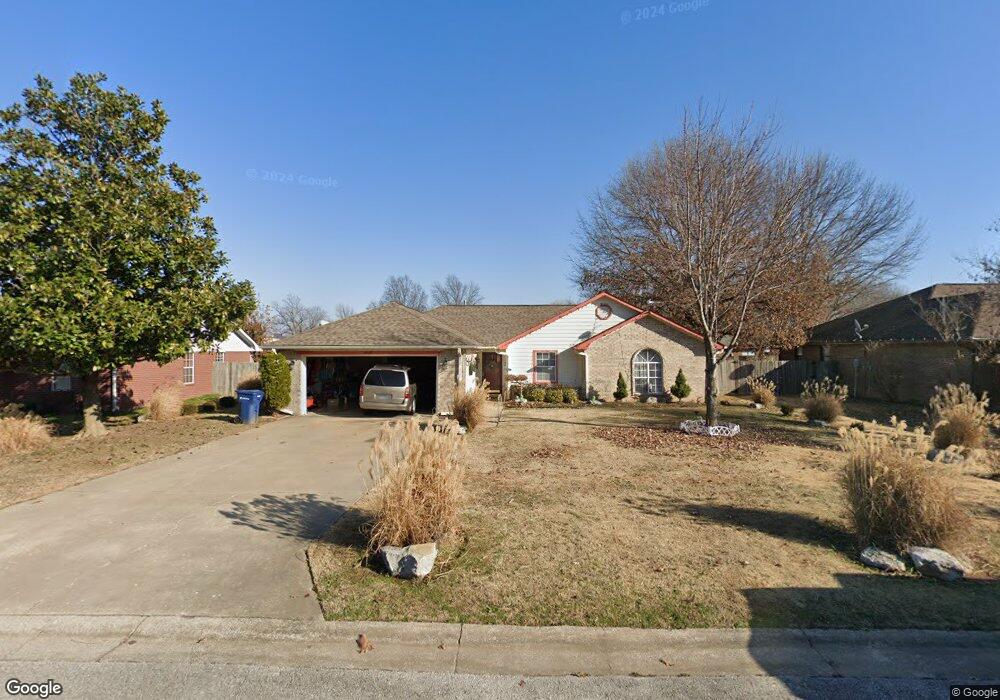
1007 S Lyndale St Siloam Springs, AR 72761
Estimated Value: $249,000 - $293,000
3
Beds
2
Baths
1,860
Sq Ft
$145/Sq Ft
Est. Value
About This Home
This home is located at 1007 S Lyndale St, Siloam Springs, AR 72761 and is currently estimated at $269,133, approximately $144 per square foot. 1007 S Lyndale St is a home located in Benton County with nearby schools including Northside Elementary School, Southside Elementary School, and Delbert Pete & Pat Allen Elementary School.
Ownership History
Date
Name
Owned For
Owner Type
Purchase Details
Closed on
Dec 21, 2021
Sold by
Ortiz Carlos A Alvarez and Reyes Carlos Alvarez
Bought by
Reyes Efrain Alvarez
Current Estimated Value
Purchase Details
Closed on
Oct 14, 2011
Sold by
Lewis Kristi and Lewis Brad
Bought by
Alvarez Carlos A and Alvarez Carlos
Home Financials for this Owner
Home Financials are based on the most recent Mortgage that was taken out on this home.
Original Mortgage
$124,489
Outstanding Balance
$85,029
Interest Rate
4.13%
Mortgage Type
New Conventional
Estimated Equity
$184,104
Purchase Details
Closed on
Mar 12, 2010
Sold by
Hopkins John Wilsford
Bought by
Hopkins John Wilsford and Salley Kristi Hopkins
Purchase Details
Closed on
Jun 2, 1997
Bought by
Hopkins
Purchase Details
Closed on
May 4, 1992
Bought by
Swanson
Create a Home Valuation Report for This Property
The Home Valuation Report is an in-depth analysis detailing your home's value as well as a comparison with similar homes in the area
Home Values in the Area
Average Home Value in this Area
Purchase History
| Date | Buyer | Sale Price | Title Company |
|---|---|---|---|
| Reyes Efrain Alvarez | -- | None Available | |
| Alvarez Carlos A | $122,000 | Stewart Title Company | |
| Hopkins John Wilsford | -- | None Available | |
| Hopkins | $101,000 | -- | |
| Swanson | $74,000 | -- |
Source: Public Records
Mortgage History
| Date | Status | Borrower | Loan Amount |
|---|---|---|---|
| Open | Alvarez Carlos A | $124,489 |
Source: Public Records
Tax History Compared to Growth
Tax History
| Year | Tax Paid | Tax Assessment Tax Assessment Total Assessment is a certain percentage of the fair market value that is determined by local assessors to be the total taxable value of land and additions on the property. | Land | Improvement |
|---|---|---|---|---|
| 2025 | $2,308 | $53,671 | $8,400 | $45,271 |
| 2024 | $2,171 | $53,671 | $8,400 | $45,271 |
| 2023 | $1,973 | $35,800 | $7,200 | $28,600 |
| 2022 | $1,814 | $35,800 | $7,200 | $28,600 |
| 2021 | $1,277 | $35,800 | $7,200 | $28,600 |
| 2020 | $1,204 | $27,410 | $2,400 | $25,010 |
| 2019 | $1,204 | $27,410 | $2,400 | $25,010 |
| 2018 | $1,199 | $27,410 | $2,400 | $25,010 |
| 2017 | $1,065 | $27,410 | $2,400 | $25,010 |
| 2016 | $1,065 | $27,410 | $2,400 | $25,010 |
| 2015 | $1,347 | $23,390 | $2,400 | $20,990 |
| 2014 | $997 | $23,390 | $2,400 | $20,990 |
Source: Public Records
Map
Nearby Homes
- 1208 Jo Lynn St
- 1702 Highway 412 W
- 0 S Carl St
- 2117 Highway 412 W
- 920 W Granite St
- Tract 2 Ok Hwy 59 & Hwy 412
- 2212 W Tulsa St
- 820 W Deer Lodge Ct
- 506 W Quarter Rd
- TBD S Hwy 59
- 1005 W Jefferson St
- 2184/2214 S State Line Rd
- 412 W Kenwood St
- 2209 W Granite St
- 419 W Hannibal St
- 301 S Dogwood St
- 600 S Elm St
- 722 S College St
- 2326 W Alpine Cir
- 817 S Katlyn Dr
- 1009 S Lyndale St
- 1005 S Lyndale St
- 1006 S Dogwood St
- 1004 S Dogwood St
- 1008 S Dogwood St
- 1155 S Lyndale St
- 1003 S Lyndale St
- 1006 S Lyndale St
- 1002 S Dogwood St
- 1008 S Lyndale St
- 1150 S Dogwood St
- 1205 S Lyndale St
- 1150 S Lyndale St
- 1002 S Lyndale St
- 1204 S Dogwood St
- 1007 Henegar Dr
- 1204 S Lyndale St
- 1005 Henegar Dr
- 1155 Henegar Dr
- 1207 S Lyndale St