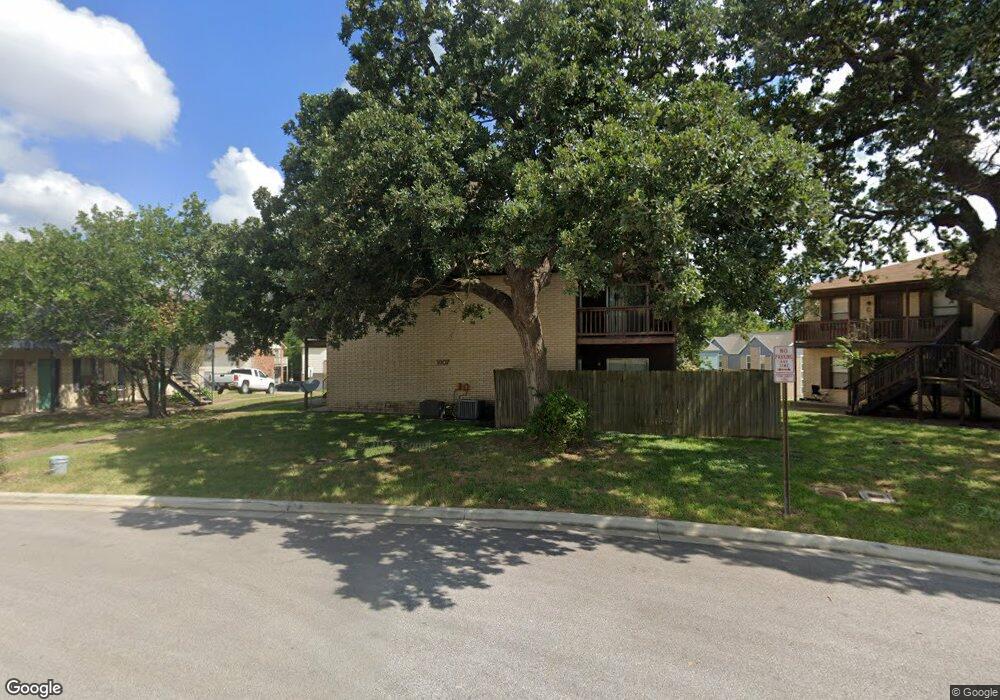
1007 Summer Court Cir Unit AD College Station, TX 77840
Estimated Value: $439,000 - $488,000
--
Bed
--
Bath
3,562
Sq Ft
$129/Sq Ft
Est. Value
About This Home
This home is located at 1007 Summer Court Cir Unit AD, College Station, TX 77840 and is currently estimated at $460,667, approximately $129 per square foot. 1007 Summer Court Cir Unit AD is a home located in Brazos County with nearby schools including College Hills Elementary School, A&M Consolidated Middle School, and Oakwood Intermediate School.
Ownership History
Date
Name
Owned For
Owner Type
Purchase Details
Closed on
Oct 29, 2014
Sold by
Mayse Properties Llc
Bought by
Zhu Fengyi and Cheng Zhengdong
Current Estimated Value
Home Financials for this Owner
Home Financials are based on the most recent Mortgage that was taken out on this home.
Original Mortgage
$179,925
Interest Rate
4.25%
Mortgage Type
New Conventional
Purchase Details
Closed on
Jun 12, 2008
Sold by
Fruhling David H and Fruhling Donnalyn S
Bought by
Mayse Properties Llc
Purchase Details
Closed on
Feb 9, 2005
Sold by
Ball Scott and Bradshaw Janice
Bought by
Fruhling David H and Fruhling Donnalyn S
Home Financials for this Owner
Home Financials are based on the most recent Mortgage that was taken out on this home.
Original Mortgage
$129,500
Interest Rate
5.85%
Mortgage Type
New Conventional
Create a Home Valuation Report for This Property
The Home Valuation Report is an in-depth analysis detailing your home's value as well as a comparison with similar homes in the area
Home Values in the Area
Average Home Value in this Area
Purchase History
| Date | Buyer | Sale Price | Title Company |
|---|---|---|---|
| Zhu Fengyi | -- | University Title Co | |
| Mayse Properties Llc | -- | University Title Company | |
| Fruhling David H | -- | Lawyers Title Co |
Source: Public Records
Mortgage History
| Date | Status | Borrower | Loan Amount |
|---|---|---|---|
| Previous Owner | Zhu Fengyi | $179,925 | |
| Previous Owner | Fruhling David H | $129,500 |
Source: Public Records
Tax History Compared to Growth
Tax History
| Year | Tax Paid | Tax Assessment Tax Assessment Total Assessment is a certain percentage of the fair market value that is determined by local assessors to be the total taxable value of land and additions on the property. | Land | Improvement |
|---|---|---|---|---|
| 2025 | $7,228 | $461,425 | $62,000 | $399,425 |
| 2024 | $7,228 | $379,284 | $61,000 | $318,284 |
| 2023 | $7,228 | $435,792 | $60,500 | $375,292 |
| 2022 | $7,853 | $368,320 | $55,000 | $313,320 |
| 2021 | $6,612 | $292,744 | $55,000 | $237,744 |
| 2020 | $6,745 | $296,991 | $55,000 | $241,991 |
| 2019 | $5,788 | $244,940 | $55,000 | $189,940 |
| 2018 | $5,597 | $235,120 | $50,000 | $185,120 |
| 2017 | $5,679 | $241,300 | $50,000 | $191,300 |
| 2016 | $5,579 | $237,050 | $50,000 | $187,050 |
| 2015 | $4,953 | $235,440 | $50,000 | $185,440 |
| 2014 | $4,953 | $213,730 | $50,000 | $163,730 |
Source: Public Records
Map
Nearby Homes
- 1011 Autumn Cir Unit AB
- 1000 Spring Loop Unit 1607
- 1000 Spring Loop Unit 1806
- 1202 Vinyard Ct Unit AB
- 1221 April Bloom Unit AB
- 152 Forest Dr Unit 152
- 208 Tarrow St
- 4513 Carter Creek Pkwy Unit 10
- 328 Forest Drive Loop
- 324 Forest Dr
- 319 Forest Dr Unit K
- 4509 Carter Creek Pkwy Unit 7
- 417 Chimney Hill Dr
- 205 Emberglow Cir
- 4403 Carter Creek Pkwy Unit 7
- 1026 Rose Cir
- 3705 Old Oaks Dr
- 828 S Rosemary Dr
- 3814 Valley Oaks Dr
- 4345 Carter Creek Pkwy Unit 1
- 1007 Summer Court Cir Unit B
- 1007 Summer Court Cir Unit A
- 1007 Summer Court Cir Unit D
- 1007 Summer Court Cir Unit C
- 1007 Summer Court Cir
- 1005 Summer Court Cir Unit AD
- 1006 Summer Court Cir Unit AD
- 1006 Summer Court Cir Unit A
- 1006 Summer Court Cir Unit D
- 1006 Summer Court Cir Unit B
- 1006 Summer Court Cir Unit C
- 1006 Summer Court Cir
- 1008 Autumn Cir Unit AD
- 1008 Autumn Cir Unit B
- 1008 Autumn Cir Unit A
- 1010 Autumn Cir Unit AD
- 1010 Autumn Cir Unit D
- 1010 Autumn Cir Unit B
- 1010 Autumn Cir
- 1012 Autumn Cir Unit AD