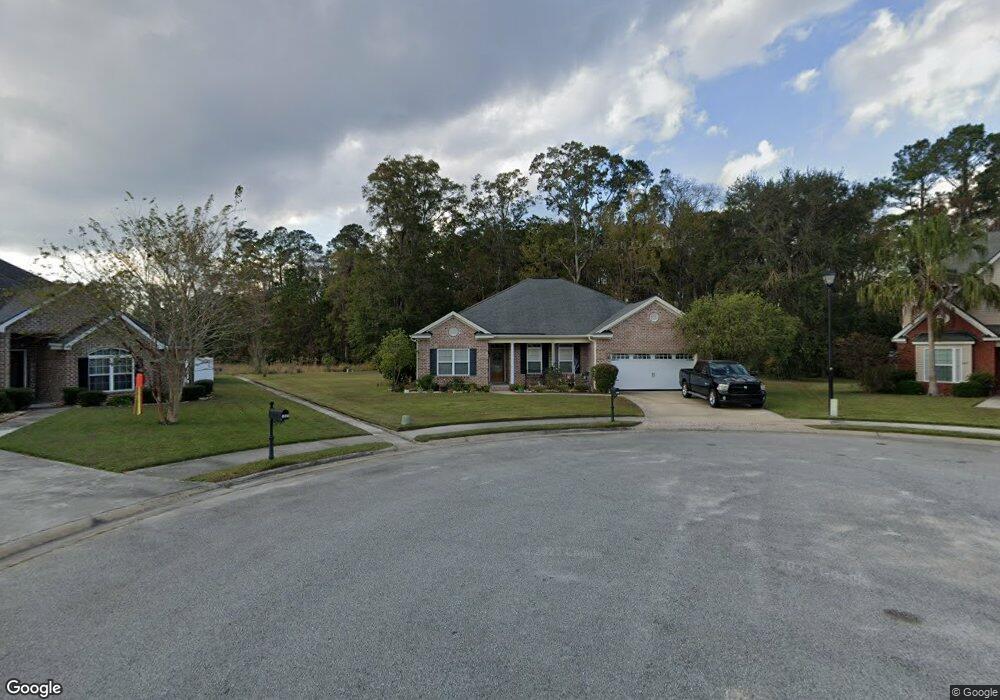
1007 White Oak Cir Hinesville, GA 31313
Estimated Value: $263,000 - $326,000
4
Beds
2
Baths
1,900
Sq Ft
$153/Sq Ft
Est. Value
About This Home
This home is located at 1007 White Oak Cir, Hinesville, GA 31313 and is currently estimated at $290,447, approximately $152 per square foot. 1007 White Oak Cir is a home located in Liberty County with nearby schools including Joseph Martin Elementary School, Midway Middle School, and Liberty County High School.
Ownership History
Date
Name
Owned For
Owner Type
Purchase Details
Closed on
Feb 1, 2010
Sold by
C Pickett Enterprises Inc
Bought by
Sheeran Lee Karen and Lee Paul
Current Estimated Value
Home Financials for this Owner
Home Financials are based on the most recent Mortgage that was taken out on this home.
Original Mortgage
$215,900
Outstanding Balance
$143,816
Interest Rate
5.16%
Mortgage Type
VA
Estimated Equity
$146,631
Purchase Details
Closed on
Oct 23, 2009
Sold by
Coastal Living Homes Inc
Bought by
C Pickett Enterprises Inc
Home Financials for this Owner
Home Financials are based on the most recent Mortgage that was taken out on this home.
Original Mortgage
$172,800
Interest Rate
5.01%
Mortgage Type
Purchase Money Mortgage
Purchase Details
Closed on
Jul 10, 2007
Sold by
Coastal Living Development & Investment
Bought by
Coastal Living Homes Inc
Create a Home Valuation Report for This Property
The Home Valuation Report is an in-depth analysis detailing your home's value as well as a comparison with similar homes in the area
Home Values in the Area
Average Home Value in this Area
Purchase History
| Date | Buyer | Sale Price | Title Company |
|---|---|---|---|
| Sheeran Lee Karen | $215,900 | -- | |
| C Pickett Enterprises Inc | $46,000 | -- | |
| Coastal Living Homes Inc | $714,000 | -- |
Source: Public Records
Mortgage History
| Date | Status | Borrower | Loan Amount |
|---|---|---|---|
| Open | Sheeran Lee Karen | $215,900 | |
| Previous Owner | C Pickett Enterprises Inc | $172,800 |
Source: Public Records
Tax History Compared to Growth
Tax History
| Year | Tax Paid | Tax Assessment Tax Assessment Total Assessment is a certain percentage of the fair market value that is determined by local assessors to be the total taxable value of land and additions on the property. | Land | Improvement |
|---|---|---|---|---|
| 2024 | $5,322 | $108,561 | $19,200 | $89,361 |
| 2023 | $5,322 | $101,649 | $19,200 | $82,449 |
| 2022 | $4,152 | $89,417 | $16,000 | $73,417 |
| 2021 | $3,739 | $79,007 | $16,000 | $63,007 |
| 2020 | $3,712 | $77,692 | $14,000 | $63,692 |
| 2019 | $3,346 | $70,524 | $12,000 | $58,524 |
| 2018 | $3,357 | $71,147 | $12,000 | $59,147 |
| 2017 | $2,363 | $71,769 | $12,000 | $59,769 |
| 2016 | $3,254 | $72,392 | $12,000 | $60,392 |
| 2015 | $3,434 | $72,392 | $12,000 | $60,392 |
| 2014 | $3,434 | $75,600 | $12,000 | $63,600 |
| 2013 | -- | $74,924 | $16,000 | $58,924 |
Source: Public Records
Map
Nearby Homes
- 929 Oak Crest Dr
- 709 Eden Ln
- 181 Legacy Ln
- 18 Providence Loop
- 15 Providence Loop
- 29 Providence Loop
- 14 Hamilton Dr
- 22 Hamilton Dr
- 30 Hamilton Dr
- 23 Hamilton Dr
- 40 Hamilton Dr
- 33 Hamilton Dr
- 737 English Oak Dr
- 48 Hamilton Dr
- 43 Hamilton Dr
- 58 Hamilton Dr
- 83 Providence Loop
- 66 Hamilton Dr
- 65 Hamilton Dr
- 400 Willow Oak Ln
- 1009 White Oak Cir
- 1005 White Oak Cir
- 1010 White Oak Cir
- 1003 White Oak Cir
- 1008 White Oak Cir
- 1001 White Oak Cir
- 927 Oak Crest Dr
- 925 Oak Crest Dr
- 925 Oak Crest
- 1006 White Oak Cir
- 804 Alyson Ct
- 808 Alyson Ct
- 1000 White Oak Cir
- 912 Oak Crest Dr
- 1002 White Oak Cir
- 802 Alyson Ct
- 422 Club Dr
- 1004 White Oak Cir
- 719 Eden Ln
- 717 Eden Ln