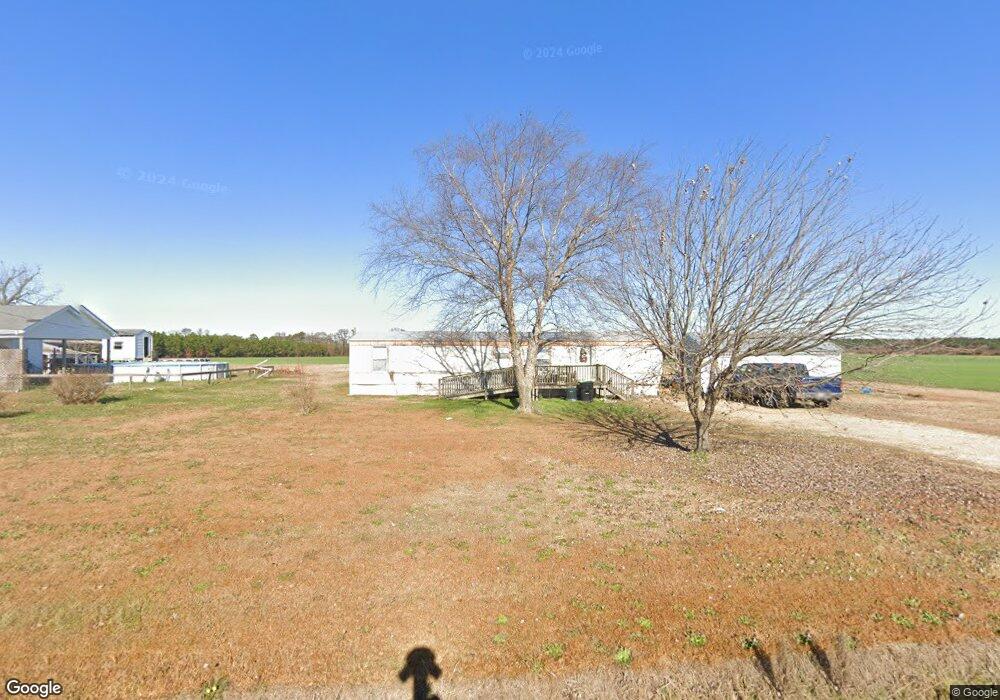
10075 Brogden Rd Princeton, NC 27569
Boon Hill NeighborhoodEstimated Value: $253,891 - $291,000
2
Beds
1
Bath
1,752
Sq Ft
$153/Sq Ft
Est. Value
About This Home
This home is located at 10075 Brogden Rd, Princeton, NC 27569 and is currently estimated at $268,723, approximately $153 per square foot. 10075 Brogden Rd is a home located in Johnston County with nearby schools including Princeton Elementary School and Princeton High.
Ownership History
Date
Name
Owned For
Owner Type
Purchase Details
Closed on
Oct 6, 2025
Sold by
Moore Goldie H and Moore Ronnie Holt
Bought by
King Kelly Marie
Current Estimated Value
Purchase Details
Closed on
Oct 6, 2015
Sold by
Moore Goldie H and Whitaker Goldie E
Bought by
Moore Goldie H
Home Financials for this Owner
Home Financials are based on the most recent Mortgage that was taken out on this home.
Original Mortgage
$45,000
Interest Rate
3.88%
Mortgage Type
Commercial
Purchase Details
Closed on
Sep 27, 2015
Sold by
Fail Foy Mae Whitaker and Fail Earl
Bought by
Morre Goldie H and Hicks Goldie Elizabeth
Home Financials for this Owner
Home Financials are based on the most recent Mortgage that was taken out on this home.
Original Mortgage
$45,000
Interest Rate
3.88%
Mortgage Type
Commercial
Purchase Details
Closed on
Dec 3, 2002
Sold by
Whitaker Goldie Elizabeth
Bought by
Hicks Goldie E
Create a Home Valuation Report for This Property
The Home Valuation Report is an in-depth analysis detailing your home's value as well as a comparison with similar homes in the area
Home Values in the Area
Average Home Value in this Area
Purchase History
| Date | Buyer | Sale Price | Title Company |
|---|---|---|---|
| King Kelly Marie | -- | None Listed On Document | |
| Moore Goldie H | -- | None Available | |
| Morre Goldie H | -- | North Carolina Land Title As | |
| Hicks Goldie E | -- | -- |
Source: Public Records
Mortgage History
| Date | Status | Borrower | Loan Amount |
|---|---|---|---|
| Previous Owner | Moore Goldie H | $45,000 |
Source: Public Records
Tax History Compared to Growth
Tax History
| Year | Tax Paid | Tax Assessment Tax Assessment Total Assessment is a certain percentage of the fair market value that is determined by local assessors to be the total taxable value of land and additions on the property. | Land | Improvement |
|---|---|---|---|---|
| 2025 | $1,471 | $230,450 | $71,100 | $159,350 |
| 2024 | $1,135 | $138,780 | $34,290 | $104,490 |
| 2023 | $1,135 | $138,780 | $34,290 | $104,490 |
| 2022 | $1,162 | $138,780 | $34,290 | $104,490 |
| 2021 | $1,138 | $135,760 | $34,290 | $101,470 |
| 2020 | $1,140 | $135,760 | $34,290 | $101,470 |
| 2019 | $1,140 | $135,760 | $34,290 | $101,470 |
| 2018 | $1,046 | $121,650 | $31,600 | $90,050 |
| 2017 | $1,046 | $121,650 | $31,600 | $90,050 |
| 2016 | $1,035 | $120,320 | $31,600 | $88,720 |
| 2015 | $1,035 | $120,320 | $31,600 | $88,720 |
| 2014 | $1,035 | $120,320 | $31,600 | $88,720 |
Source: Public Records
Map
Nearby Homes
- 56 Yardley Dr
- 152 Christopher Ave
- 40 Kenbridge Ln
- 2582 Bakers Chapel Rd
- 2166 Braswell Rd
- 6450 Highway 70 E
- 00 New King Rd
- 125 Lakeview Estates
- 2886 Steven's Chapel Rd
- 125 Lakeview Estates Dr
- 309 Shoreline Dr
- 83 Tuskeegee Dr
- 296 Shoreline Dr
- 218 Lotus Ave
- 125 Tuskeegee Dr
- 170 Lotus Ave
- 400 Lazy j Dr
- 187 Tuskeegee Dr
- 76 Tuskeegee Dr
- 138 Lotus Ave
- 9925 Brogden Rd
- 9731 Brogden Rd
- 2554 Woodard Rd
- 2500 Woodard Rd
- 2453 Woodard Rd
- 2480 Woodard Rd
- 2419 Woodard Rd
- 4496 Progressive Church Rd
- 2278 Woodard Rd
- 10594 Brogden Rd
- 4491 Progressive Church Rd
- 4493 Progressive Church Rd
- 4415 Progressive Church Rd
- 2099 Woodard Rd
- 2081 Woodard Rd
- 2142 Woodard Rd
- 4208 Progressive Church Rd
- 10678 Brogden Rd
- 2041 Woodard Rd
- 4174 Progressive Church Rd