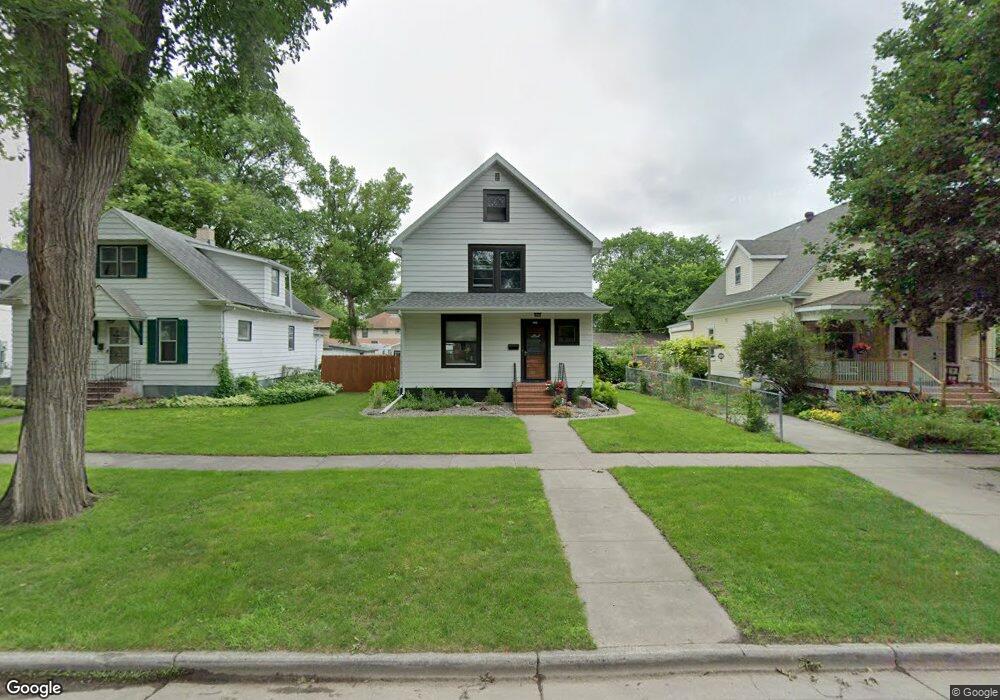
1008 5th St N Fargo, ND 58102
Horace Mann NeighborhoodEstimated Value: $307,000 - $365,000
4
Beds
2
Baths
2,556
Sq Ft
$128/Sq Ft
Est. Value
About This Home
This home is located at 1008 5th St N, Fargo, ND 58102 and is currently estimated at $328,059, approximately $128 per square foot. 1008 5th St N is a home located in Cass County with nearby schools including Horace Mann Roosevelt Elementary School, Ben Franklin Middle School, and North High School.
Ownership History
Date
Name
Owned For
Owner Type
Purchase Details
Closed on
Aug 29, 2016
Sold by
Terry Bishop
Bought by
Mcfarlane Kimberly and Mcfarlane Koby
Current Estimated Value
Home Financials for this Owner
Home Financials are based on the most recent Mortgage that was taken out on this home.
Original Mortgage
$142,274
Outstanding Balance
$113,643
Interest Rate
3.43%
Estimated Equity
$214,416
Purchase Details
Closed on
Dec 1, 2015
Sold by
Schultz Properties 2 Llc
Bought by
Thompson Bruce E and Thompson Elizabeth M
Purchase Details
Closed on
Aug 5, 2009
Sold by
Craik Milo and Craik Ruby
Bought by
Schultz Properties Nd No 2 Llc
Home Financials for this Owner
Home Financials are based on the most recent Mortgage that was taken out on this home.
Original Mortgage
$108,157
Interest Rate
5.49%
Mortgage Type
Commercial
Purchase Details
Closed on
Jun 2, 2006
Sold by
Crank Milo and Crank Ruby
Bought by
Schultz Ron
Create a Home Valuation Report for This Property
The Home Valuation Report is an in-depth analysis detailing your home's value as well as a comparison with similar homes in the area
Home Values in the Area
Average Home Value in this Area
Purchase History
| Date | Buyer | Sale Price | Title Company |
|---|---|---|---|
| Mcfarlane Kimberly | -- | -- | |
| Thompson Bruce E | $172,000 | Title Co | |
| Schultz Properties Nd No 2 Llc | -- | -- | |
| Schultz Ron | $134,250 | -- |
Source: Public Records
Mortgage History
| Date | Status | Borrower | Loan Amount |
|---|---|---|---|
| Open | Mcfarlane Kimberly | $142,274 | |
| Closed | Mcfarlane Kimberly | -- | |
| Previous Owner | Schultz Properties Nd No 2 Llc | $108,157 |
Source: Public Records
Tax History Compared to Growth
Tax History
| Year | Tax Paid | Tax Assessment Tax Assessment Total Assessment is a certain percentage of the fair market value that is determined by local assessors to be the total taxable value of land and additions on the property. | Land | Improvement |
|---|---|---|---|---|
| 2024 | $3,972 | $156,100 | $20,800 | $135,300 |
| 2023 | $3,971 | $138,150 | $20,800 | $117,350 |
| 2022 | $3,520 | $124,450 | $20,800 | $103,650 |
| 2021 | $2,546 | $90,200 | $20,800 | $69,400 |
| 2020 | $2,311 | $82,450 | $20,800 | $61,650 |
| 2019 | $2,313 | $82,450 | $12,350 | $70,100 |
| 2018 | $2,236 | $80,550 | $12,350 | $68,200 |
| 2017 | $2,118 | $76,850 | $12,350 | $64,500 |
| 2016 | $1,848 | $76,850 | $12,350 | $64,500 |
| 2015 | $2,125 | $83,050 | $8,450 | $74,600 |
| 2014 | $1,983 | $75,500 | $8,450 | $67,050 |
| 2013 | $1,928 | $73,300 | $8,450 | $64,850 |
Source: Public Records
Map
Nearby Homes
- 1010 5th St N
- 1006 5th St N
- 1014 5th St N
- 1002 5th St N
- 1002 5th St N Unit 3
- 1002 5th St N Unit 1
- 1016 5th St N
- 1009 Broadway N
- 1013 Broadway N
- 1005 Broadway N
- 1005-1007 Broadway N
- 1001 Broadway N
- 1018 5th St N
- 1009 5th St N
- 1013 5th St N
- 1007 5th St N
- 920 5th St N
- 1017 5th St N
- 1020 5th St N
- 1001 5th St N