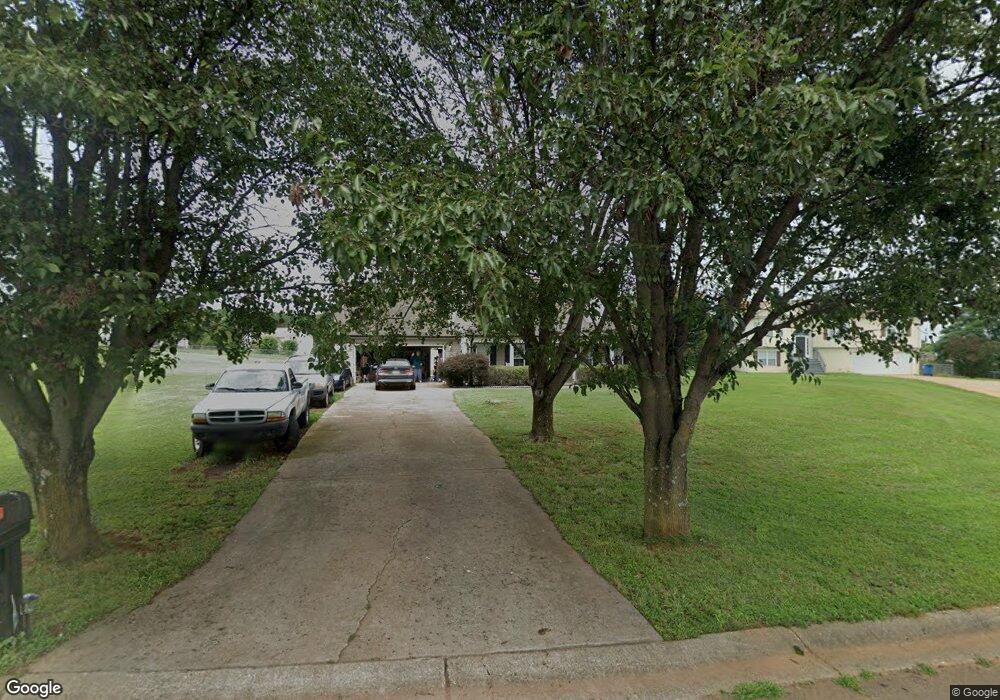
1008 Brynn Dr Winder, GA 30680
Estimated Value: $322,467 - $342,000
3
Beds
2
Baths
1,453
Sq Ft
$229/Sq Ft
Est. Value
About This Home
This home is located at 1008 Brynn Dr, Winder, GA 30680 and is currently estimated at $333,367, approximately $229 per square foot. 1008 Brynn Dr is a home located in Barrow County with nearby schools including Holsenbeck Elementary School, Bear Creek Middle School, and Winder-Barrow High School.
Ownership History
Date
Name
Owned For
Owner Type
Purchase Details
Closed on
Jul 26, 2010
Sold by
Greeson Christopher D
Bought by
Lapina Damon K and Lapina Caroline S
Current Estimated Value
Home Financials for this Owner
Home Financials are based on the most recent Mortgage that was taken out on this home.
Original Mortgage
$64,900
Outstanding Balance
$42,834
Interest Rate
4.74%
Mortgage Type
New Conventional
Estimated Equity
$290,533
Purchase Details
Closed on
Jul 25, 2000
Sold by
Bradley Daniel
Bought by
Greeson Christopher
Home Financials for this Owner
Home Financials are based on the most recent Mortgage that was taken out on this home.
Original Mortgage
$91,500
Interest Rate
8.23%
Mortgage Type
New Conventional
Purchase Details
Closed on
May 22, 1980
Bought by
Patterson Ray and Patterson Bren
Create a Home Valuation Report for This Property
The Home Valuation Report is an in-depth analysis detailing your home's value as well as a comparison with similar homes in the area
Home Values in the Area
Average Home Value in this Area
Purchase History
| Date | Buyer | Sale Price | Title Company |
|---|---|---|---|
| Lapina Damon K | $94,900 | -- | |
| Greeson Christopher | -- | -- | |
| Patterson Ray | -- | -- |
Source: Public Records
Mortgage History
| Date | Status | Borrower | Loan Amount |
|---|---|---|---|
| Open | Lapina Damon K | $64,900 | |
| Previous Owner | Greeson Christopher | $91,500 |
Source: Public Records
Tax History
| Year | Tax Paid | Tax Assessment Tax Assessment Total Assessment is a certain percentage of the fair market value that is determined by local assessors to be the total taxable value of land and additions on the property. | Land | Improvement |
|---|---|---|---|---|
| 2025 | $941 | $94,098 | $24,000 | $70,098 |
| 2024 | $977 | $92,151 | $24,000 | $68,151 |
| 2023 | $708 | $75,219 | $18,000 | $57,219 |
| 2022 | $577 | $61,017 | $16,000 | $45,017 |
| 2021 | $1,803 | $61,017 | $16,000 | $45,017 |
| 2020 | $1,804 | $61,017 | $16,000 | $45,017 |
| 2019 | $1,834 | $61,017 | $16,000 | $45,017 |
| 2018 | $1,630 | $55,084 | $12,000 | $43,084 |
| 2017 | $1,244 | $42,718 | $12,000 | $30,718 |
| 2016 | $1,232 | $43,073 | $12,000 | $31,073 |
| 2015 | $1,248 | $43,428 | $12,000 | $31,428 |
| 2014 | $1,081 | $37,662 | $5,880 | $31,782 |
| 2013 | -- | $35,806 | $5,880 | $29,926 |
Source: Public Records
Map
Nearby Homes
- 917 Justin Dr Unit 3
- 388 Kay Dr Unit 1
- 973 Vera Ct
- 1556 Shoal Creek Dr
- 1553 Shoal Creek Dr
- 614 Anns Way
- 508 Pleasant Hill Church Rd NE
- 56 Candler Park Ct
- 246 Pleasant Hill Church Rd NE
- 63 Delightful Way Unit 1
- 698 Melinda Dr
- 162 Delightful Way Unit 28
- 83 Beech Creek Cir
- 253 Delightful Way Unit 6
- 91 Beech Creek Cir
- 230 Delightful Way Unit 23
- 281 Delightful Way Unit 7
- 16 Fox Dr
- 99 Beech Creek Cir
- 296 Delightful Way Unit 22
- 1010 Brynn Dr
- 1004 Brynn Dr Unit 2
- 1012 Brynn Dr
- 1009 Brynn Dr Unit 2
- 375 Kay Dr
- 1007 Brynn Dr Unit 2
- 373 Kay Dr
- 377 Kay Dr Unit 1
- 1005 Brynn Dr
- 1013 Brynn Dr
- 1057 Taylor Ct Unit 2
- 1055 Taylor Ct
- 1055 Taylor Ct Unit 2
- 1059 Taylor Ct
- 1003 Brynn Dr Unit 2
- 1003 Brynn Dr
- 379 Kay Dr Unit 1
- 369 Kay Dr
- 1061 Taylor Ct Unit 2
- 1053 Taylor Ct
Your Personal Tour Guide
Ask me questions while you tour the home.