Estimated Value: $73,000 - $94,538
2
Beds
1
Bath
1,814
Sq Ft
$45/Sq Ft
Est. Value
About This Home
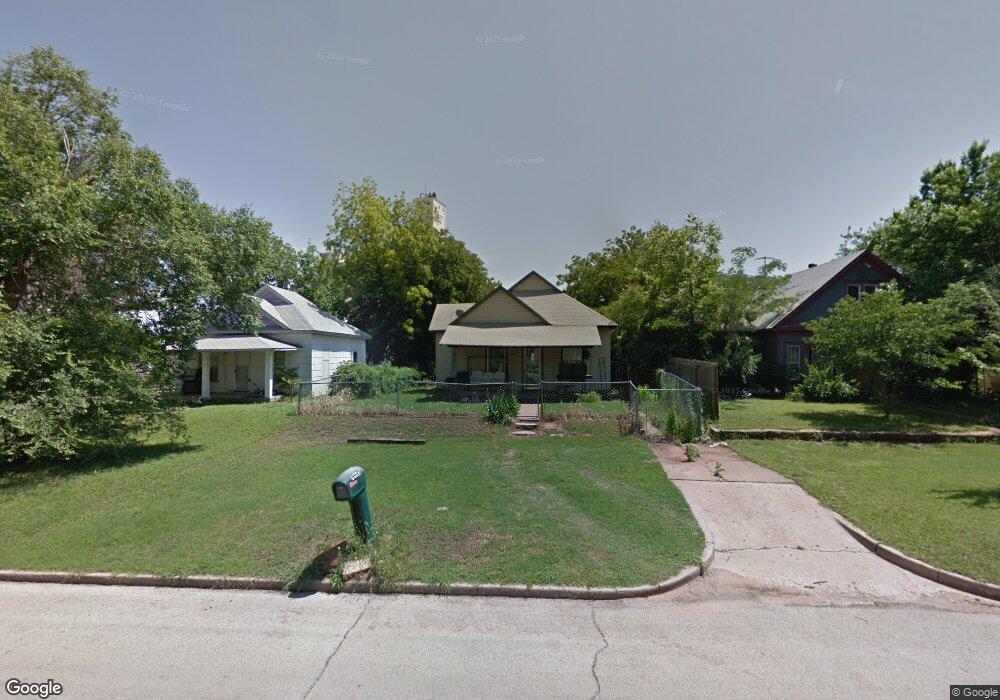
This home is located at 1008 Cedar St, Perry, OK 73077 and is currently estimated at $81,885, approximately $45 per square foot. 1008 Cedar St is a home located in Noble County with nearby schools including Perry Elementary School and Perry High School.
Ownership History
Date
Name
Owned For
Owner Type
Purchase Details
Closed on
Dec 13, 2021
Sold by
Price Betty Lou and Jones Donna Sue
Bought by
Robbins Laura
Current Estimated Value
Purchase Details
Closed on
Oct 25, 2007
Sold by
Phillips Jesse H and Jesse H Phillips Living Trust
Bought by
Price Betty L
Home Financials for this Owner
Home Financials are based on the most recent Mortgage that was taken out on this home.
Original Mortgage
$26,500
Interest Rate
6.32%
Mortgage Type
Purchase Money Mortgage
Purchase Details
Closed on
Oct 30, 1992
Bought by
Phillips Jesse Living Tru
Create a Home Valuation Report for This Property
The Home Valuation Report is an in-depth analysis detailing your home's value as well as a comparison with similar homes in the area
Home Values in the Area
Average Home Value in this Area
Purchase History
| Date | Buyer | Sale Price | Title Company |
|---|---|---|---|
| Robbins Laura | $14,500 | None Available | |
| Price Betty L | $27,500 | None Available | |
| Phillips Jesse Living Tru | -- | -- |
Source: Public Records
Mortgage History
| Date | Status | Borrower | Loan Amount |
|---|---|---|---|
| Previous Owner | Price Betty L | $26,500 |
Source: Public Records
Tax History
| Year | Tax Paid | Tax Assessment Tax Assessment Total Assessment is a certain percentage of the fair market value that is determined by local assessors to be the total taxable value of land and additions on the property. | Land | Improvement |
|---|---|---|---|---|
| 2025 | $247 | $2,408 | $173 | $2,235 |
| 2024 | $239 | $2,408 | $173 | $2,235 |
| 2023 | $239 | $2,408 | $173 | $2,235 |
| 2022 | $236 | $2,408 | $173 | $2,235 |
| 2021 | $253 | $2,408 | $173 | $2,235 |
| 2020 | $402 | $3,808 | $173 | $3,635 |
| 2019 | $370 | $3,657 | $173 | $3,484 |
| 2018 | $383 | $3,697 | $173 | $3,524 |
| 2017 | $369 | $3,632 | $173 | $3,459 |
| 2016 | $371 | $3,691 | $242 | $3,449 |
| 2015 | $370 | $3,561 | $242 | $3,319 |
| 2014 | $355 | $3,391 | $242 | $3,149 |
Source: Public Records
Map
Nearby Homes
Your Personal Tour Guide
Ask me questions while you tour the home.