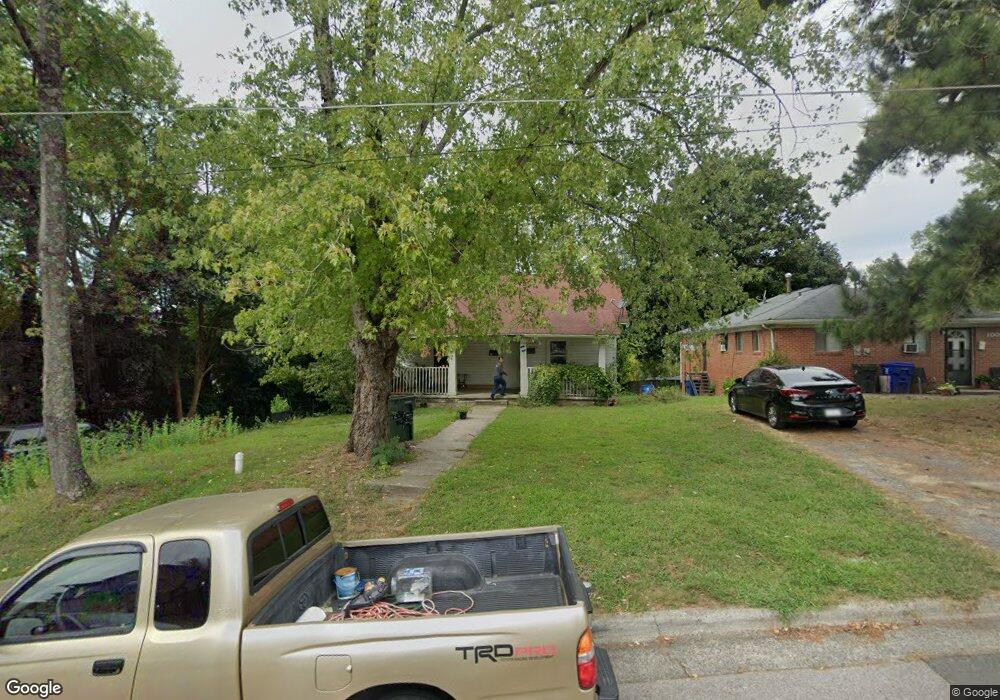
1008 Colfax St Durham, NC 27701
Hayti District NeighborhoodEstimated Value: $230,000 - $346,000
3
Beds
3
Baths
1,096
Sq Ft
$260/Sq Ft
Est. Value
About This Home
This home is located at 1008 Colfax St, Durham, NC 27701 and is currently estimated at $284,750, approximately $259 per square foot. 1008 Colfax St is a home located in Durham County with nearby schools including Canistota Elementary School, Fayetteville Street Elementary School, and James E. Shepard Middle School.
Ownership History
Date
Name
Owned For
Owner Type
Purchase Details
Closed on
Jul 3, 2013
Sold by
Murray Crishna
Bought by
Wu Yuanqing
Current Estimated Value
Purchase Details
Closed on
Sep 13, 2011
Sold by
Triangle Citizens Rebuilding Communities
Bought by
Murray Crishna
Purchase Details
Closed on
Sep 2, 2011
Sold by
Davis Vincent C and Estate Of Victoria C Mccants
Bought by
Triangle Citizens Rebuilding Communities
Purchase Details
Closed on
Aug 31, 2011
Sold by
Cordice John W V and Cordice Marguerite
Bought by
Triangle Citizens Rebuilding Communities
Purchase Details
Closed on
Apr 27, 2009
Sold by
Parham Marion C and Davis Vincent C
Bought by
Triangle Citizens Rebuilding Communities
Purchase Details
Closed on
Sep 27, 2005
Sold by
Cordice John W V and Cordice Marguerite
Bought by
Mccants Victoria C
Create a Home Valuation Report for This Property
The Home Valuation Report is an in-depth analysis detailing your home's value as well as a comparison with similar homes in the area
Home Values in the Area
Average Home Value in this Area
Purchase History
| Date | Buyer | Sale Price | Title Company |
|---|---|---|---|
| Wu Yuanqing | $16,500 | None Available | |
| Murray Crishna | $11,000 | None Available | |
| Triangle Citizens Rebuilding Communities | -- | None Available | |
| Triangle Citizens Rebuilding Communities | -- | None Available | |
| Triangle Citizens Rebuilding Communities | -- | None Available | |
| Mccants Victoria C | -- | None Available | |
| Parham Marion C | -- | None Available |
Source: Public Records
Tax History Compared to Growth
Tax History
| Year | Tax Paid | Tax Assessment Tax Assessment Total Assessment is a certain percentage of the fair market value that is determined by local assessors to be the total taxable value of land and additions on the property. | Land | Improvement |
|---|---|---|---|---|
| 2025 | $2,618 | $264,129 | $105,875 | $158,254 |
| 2024 | $1,127 | $80,796 | $24,180 | $56,616 |
| 2023 | $1,058 | $80,796 | $24,180 | $56,616 |
| 2022 | $1,034 | $80,796 | $24,180 | $56,616 |
| 2021 | $1,029 | $80,796 | $24,180 | $56,616 |
| 2020 | $1,005 | $80,796 | $24,180 | $56,616 |
| 2019 | $1,005 | $80,796 | $24,180 | $56,616 |
| 2018 | $928 | $68,401 | $10,881 | $57,520 |
| 2017 | $921 | $68,401 | $10,881 | $57,520 |
| 2016 | $890 | $68,401 | $10,881 | $57,520 |
| 2015 | $638 | $46,096 | $18,232 | $27,864 |
| 2014 | $638 | $46,096 | $18,232 | $27,864 |
Source: Public Records
Map
Nearby Homes
- 1213 Grant St
- 913 Grant St
- 915 Grant St
- 300 Price Ave
- 911 Grant St
- 627 Price Ave
- 803 B Dupree St
- 803 A Dupree St
- 901 Dupree St
- 618 Price Ave
- 805 Ridgeway Ave
- 602 Dunbar St
- 605 Dupree St
- 608 E Umstead St
- 500 Potter St
- 508 Lakeland St Unit B
- 508 Lakeland St Unit A
- 1306 Rosewood St
- 425 Price Ave
- 1608 Fayetteville St
- 1006 Colfax St
- 809 Massey Ave
- 811 Massey Ave
- 807 Massey Ave
- 1007 Grant St
- 805 Massey Ave
- 1003 Grant St
- 908 Linwood Ave
- 906 Linwood Ave
- 901 Massey Ave
- 1005 Colfax St
- 1002 Linwood Ave
- 801 Massey Ave
- 1000 Linwood Ave
- 1007 Colfax St
- 1009 Colfax St
- 1004 Linwood Ave
- 904 Linwood Ave
- 903 Massey Ave
- 808 Massey Ave