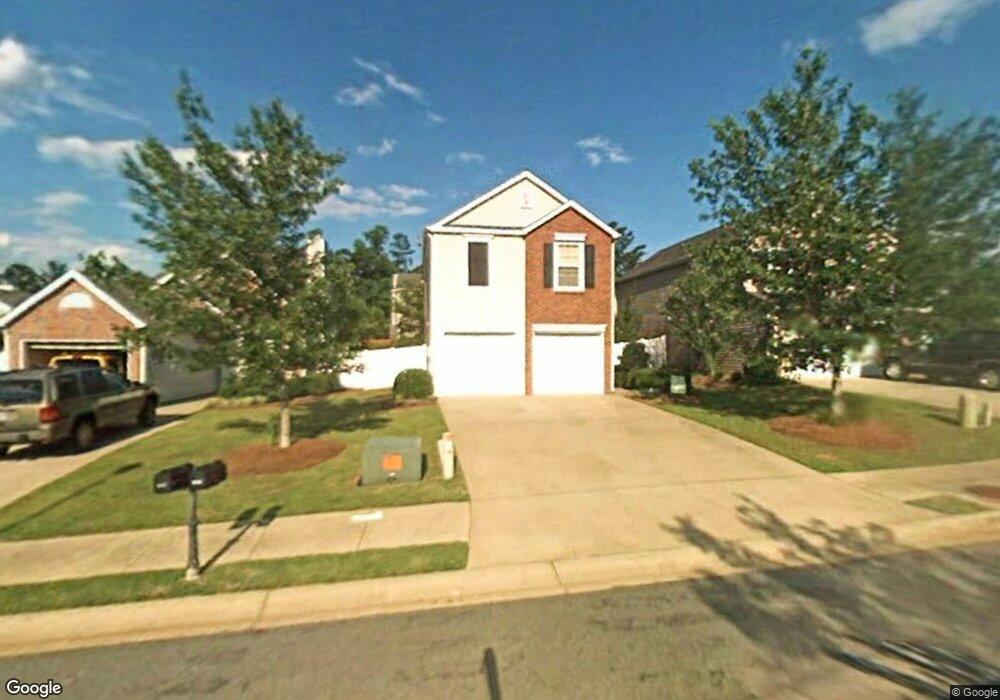
1008 Daventry Crossing Woodstock, GA 30188
Estimated Value: $317,000
3
Beds
3
Baths
1,408
Sq Ft
$225/Sq Ft
Est. Value
About This Home
This home is located at 1008 Daventry Crossing, Woodstock, GA 30188 and is currently estimated at $317,000, approximately $225 per square foot. 1008 Daventry Crossing is a home located in Cherokee County with nearby schools including Arnold Mill Elementary School, Mill Creek Middle School, and River Ridge High School.
Ownership History
Date
Name
Owned For
Owner Type
Purchase Details
Closed on
Jun 20, 2007
Sold by
Us Bank Na Trust 2005-He2
Bought by
Sergile Patricia S
Current Estimated Value
Home Financials for this Owner
Home Financials are based on the most recent Mortgage that was taken out on this home.
Original Mortgage
$111,600
Interest Rate
6.65%
Mortgage Type
New Conventional
Purchase Details
Closed on
Nov 7, 2006
Sold by
Coverson Larry and Coverson Cammilla
Bought by
Structured Asset Inv Loan Trus
Purchase Details
Closed on
Apr 26, 2005
Sold by
Jones Janice E
Bought by
Coverson Larry and Coverson Cammilla
Home Financials for this Owner
Home Financials are based on the most recent Mortgage that was taken out on this home.
Original Mortgage
$28,600
Interest Rate
5.98%
Mortgage Type
Stand Alone Refi Refinance Of Original Loan
Create a Home Valuation Report for This Property
The Home Valuation Report is an in-depth analysis detailing your home's value as well as a comparison with similar homes in the area
Home Values in the Area
Average Home Value in this Area
Purchase History
| Date | Buyer | Sale Price | Title Company |
|---|---|---|---|
| Sergile Patricia S | $139,500 | -- | |
| Structured Asset Inv Loan Trus | $130,031 | -- | |
| Coverson Larry | $143,000 | -- |
Source: Public Records
Mortgage History
| Date | Status | Borrower | Loan Amount |
|---|---|---|---|
| Previous Owner | Sergile Patricia S | $111,600 | |
| Previous Owner | Coverson Larry | $28,600 |
Source: Public Records
Tax History Compared to Growth
Tax History
| Year | Tax Paid | Tax Assessment Tax Assessment Total Assessment is a certain percentage of the fair market value that is determined by local assessors to be the total taxable value of land and additions on the property. | Land | Improvement |
|---|---|---|---|---|
| 2025 | $3,665 | $139,576 | $25,200 | $114,376 |
| 2024 | $3,531 | $135,876 | $25,200 | $110,676 |
| 2023 | $3,203 | $123,260 | $24,000 | $99,260 |
| 2022 | $2,836 | $107,920 | $20,000 | $87,920 |
| 2021 | $2,610 | $91,940 | $16,000 | $75,940 |
| 2020 | $2,336 | $82,204 | $12,000 | $70,204 |
| 2019 | $2,227 | $78,360 | $12,000 | $66,360 |
| 2018 | $1,877 | $65,640 | $12,000 | $53,640 |
| 2017 | $1,744 | $151,300 | $12,000 | $48,520 |
| 2016 | $1,606 | $137,900 | $9,600 | $45,560 |
| 2015 | $1,543 | $131,200 | $9,600 | $42,880 |
| 2014 | $1,376 | $116,800 | $9,600 | $37,120 |
Source: Public Records
Map
Nearby Homes
- 1010 Daventry Crossing
- 1006 Daventry Crossing
- 103 Kincade Ct Unit 1
- 202 Daventry Way Unit 202
- 202 Daventry Way
- 202 Daventry Way
- 204 Daventry Way
- 200 Daventry Way
- 206 Daventry Way
- 208 Daventry Way
- 108 Kincade Ct Unit 1
- 1015 Daventry Crossing
- 1013 Daventry Crossing
- 1017 Daventry Crossing
- 106 Kincade Ct
- 1011 Daventry Crossing Unit 1
- 1007 Daventry Crossing Unit 1
- 1005 Daventry Crossing
- 1019 Daventry Crossing
- 1009 Daventry Crossing