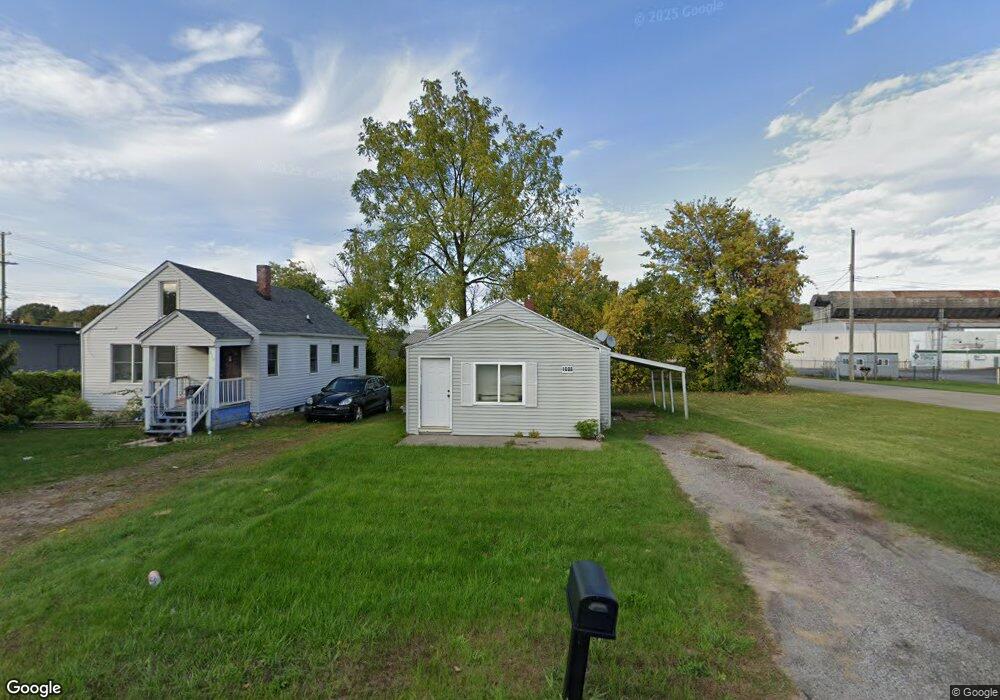
1008 Dunlap St Lansing, MI 48910
Old Everett NeighborhoodEstimated Value: $85,953 - $114,000
2
Beds
1
Bath
774
Sq Ft
$123/Sq Ft
Est. Value
About This Home
This home is located at 1008 Dunlap St, Lansing, MI 48910 and is currently estimated at $95,238, approximately $123 per square foot. 1008 Dunlap St is a home located in Ingham County with nearby schools including Lyons Elementary School, Attwood School, and Everett High School.
Ownership History
Date
Name
Owned For
Owner Type
Purchase Details
Closed on
Oct 4, 2007
Sold by
Brandon Maurice and Brandon Sierra
Bought by
Deutsche Bank National Trust Co and Long Beach Mortgage Loan Trust 2005-2
Current Estimated Value
Purchase Details
Closed on
Aug 9, 2004
Sold by
Hud
Bought by
Brandon Maurice
Purchase Details
Closed on
Mar 24, 2004
Sold by
Union Federal Bank Of Indianapolis
Bought by
Hud
Purchase Details
Closed on
Sep 11, 2003
Sold by
Ebright Justin R
Bought by
Union Federal Bank Of Indianapolis
Purchase Details
Closed on
Dec 20, 2002
Sold by
Ovalle Jose H and Wrigglesworth Rhea R
Bought by
Ebright Justin R
Home Financials for this Owner
Home Financials are based on the most recent Mortgage that was taken out on this home.
Original Mortgage
$43,464
Interest Rate
5.94%
Mortgage Type
FHA
Purchase Details
Closed on
Apr 25, 2000
Sold by
Va
Bought by
Ovalle Jose H
Purchase Details
Closed on
Mar 27, 1988
Bought by
Ovalle Jose H
Create a Home Valuation Report for This Property
The Home Valuation Report is an in-depth analysis detailing your home's value as well as a comparison with similar homes in the area
Home Values in the Area
Average Home Value in this Area
Purchase History
| Date | Buyer | Sale Price | Title Company |
|---|---|---|---|
| Deutsche Bank National Trust Co | $31,000 | None Available | |
| Brandon Maurice | -- | Tnt | |
| Hud | -- | -- | |
| Union Federal Bank Of Indianapolis | $46,863 | -- | |
| Ebright Justin R | $44,000 | Metropolitan Title Okemos | |
| Ovalle Jose H | -- | -- | |
| Ovalle Jose H | -- | -- |
Source: Public Records
Mortgage History
| Date | Status | Borrower | Loan Amount |
|---|---|---|---|
| Previous Owner | Ebright Justin R | $43,464 |
Source: Public Records
Tax History Compared to Growth
Tax History
| Year | Tax Paid | Tax Assessment Tax Assessment Total Assessment is a certain percentage of the fair market value that is determined by local assessors to be the total taxable value of land and additions on the property. | Land | Improvement |
|---|---|---|---|---|
| 2025 | $1,526 | $34,900 | $5,200 | $29,700 |
| 2024 | $12 | $28,600 | $5,200 | $23,400 |
| 2023 | $1,438 | $25,200 | $5,200 | $20,000 |
| 2022 | $1,317 | $22,000 | $5,200 | $16,800 |
| 2021 | $1,287 | $20,100 | $2,600 | $17,500 |
| 2020 | $1,277 | $18,800 | $2,600 | $16,200 |
| 2019 | $2,181 | $18,100 | $2,600 | $15,500 |
| 2018 | $1,170 | $14,800 | $2,600 | $12,200 |
| 2017 | $1,125 | $14,800 | $2,600 | $12,200 |
| 2016 | $2,044 | $14,500 | $2,600 | $11,900 |
| 2015 | $2,044 | $14,000 | $5,236 | $8,764 |
| 2014 | $2,044 | $13,700 | $3,141 | $10,559 |
Source: Public Records
Map
Nearby Homes
- 924 Loa St
- 2515 S Martin Luther King Junior Blvd
- 1032 Kelsey Ave
- 2421 Stirling Ave
- 1120 Kelsey Ave
- 2806 S Washington Ave
- 0 Rickle
- 1607 Holly Way
- 815 Woodbine Ave
- 2310 Stirling Ave
- 1404 Kelsey Ave
- 2901 Palmer St
- 715 W Holmes Rd
- 2313 S Rundle Ave
- 410 Dunlap St
- 1618 Loraine Ave
- 334 Dunlap St
- 2112 Stirling Ave
- 3322 Palmer St
- 2118 Marion Ave
- 1004 Dunlap St
- 1010 Dunlap St
- 36 Dunlap St
- 916 Dunlap St
- 921 Dunlap St
- 914 Dunlap St
- 919 Dunlap St
- 910 Dunlap St
- 915 Dunlap St
- 906 Dunlap St
- 922 Loa St
- 3010 Stirling Ave
- 920 Loa St
- 3101 S Martin Luther King Junior Blvd Unit Suite 2
- 3101 S Martin Luther King Junior Blvd Unit Suite 1
- 2829 S Martin Luther King jr Blvd
- 3020 Stirling Ave
- 1007 Loa St
- 1011 Loa St
- 820 Dunlap St