1008 E 2nd St Redfield, SD 57469
Estimated Value: $98,000 - $118,369
3
Beds
2
Baths
884
Sq Ft
$123/Sq Ft
Est. Value
About This Home
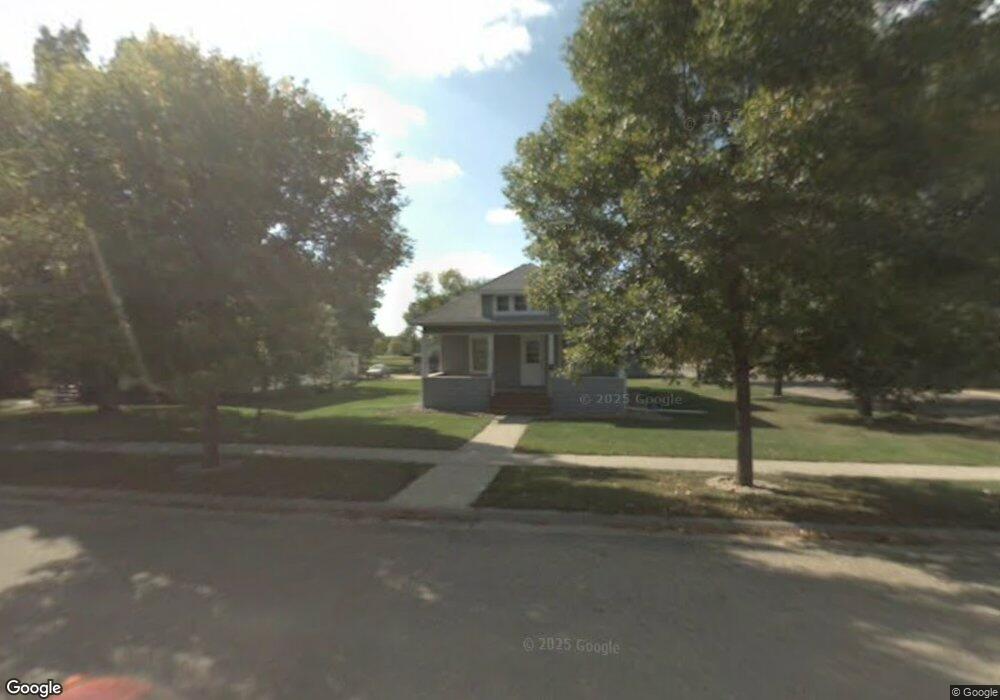
This home is located at 1008 E 2nd St, Redfield, SD 57469 and is currently estimated at $108,592, approximately $122 per square foot. 1008 E 2nd St is a home located in Spink County with nearby schools including Redfield Elementary School, Redfield Junior High School, and Redfield High School.
Ownership History
Date
Name
Owned For
Owner Type
Purchase Details
Closed on
Jul 2, 2021
Bought by
Loveland Lynn and Loveland Cindy
Current Estimated Value
Purchase Details
Closed on
Apr 12, 2021
Bought by
Loveland Lynn and Loveland Cindy
Purchase Details
Closed on
Mar 21, 2013
Sold by
Campbell Galen and Campbell Elizabeth
Bought by
Warning Wesly
Home Financials for this Owner
Home Financials are based on the most recent Mortgage that was taken out on this home.
Original Mortgage
$63,265
Interest Rate
3.52%
Mortgage Type
Stand Alone First
Create a Home Valuation Report for This Property
The Home Valuation Report is an in-depth analysis detailing your home's value as well as a comparison with similar homes in the area
Purchase History
| Date | Buyer | Sale Price | Title Company |
|---|---|---|---|
| Loveland Lynn | $72,500 | -- | |
| Loveland Lynn | $62,500 | -- | |
| Warning Wesly | -- | Spink County Abstract |
Source: Public Records
Mortgage History
| Date | Status | Borrower | Loan Amount |
|---|---|---|---|
| Previous Owner | Warning Wesly | $63,265 |
Source: Public Records
Tax History
| Year | Tax Paid | Tax Assessment Tax Assessment Total Assessment is a certain percentage of the fair market value that is determined by local assessors to be the total taxable value of land and additions on the property. | Land | Improvement |
|---|---|---|---|---|
| 2025 | $1,588 | $78,799 | $6,552 | $72,247 |
| 2023 | $1,349 | $69,227 | $5,460 | $63,767 |
| 2022 | $1,349 | $62,170 | $4,200 | $57,970 |
| 2021 | $1,330 | $62,180 | $4,210 | $57,970 |
| 2020 | $1,341 | $62,180 | $4,210 | $57,970 |
| 2019 | $1,437 | $61,977 | $4,007 | $57,970 |
| 2018 | $1,533 | $61,977 | $4,007 | $57,970 |
| 2017 | $1,518 | $61,977 | $4,007 | $57,970 |
| 2016 | $1,544 | $61,977 | $4,007 | $57,970 |
| 2015 | -- | $61,977 | $4,007 | $57,970 |
| 2014 | -- | $61,977 | $4,007 | $57,970 |
| 2013 | -- | $60,696 | $4,007 | $56,689 |
Source: Public Records
Map
Nearby Homes
Your Personal Tour Guide
Ask me questions while you tour the home.