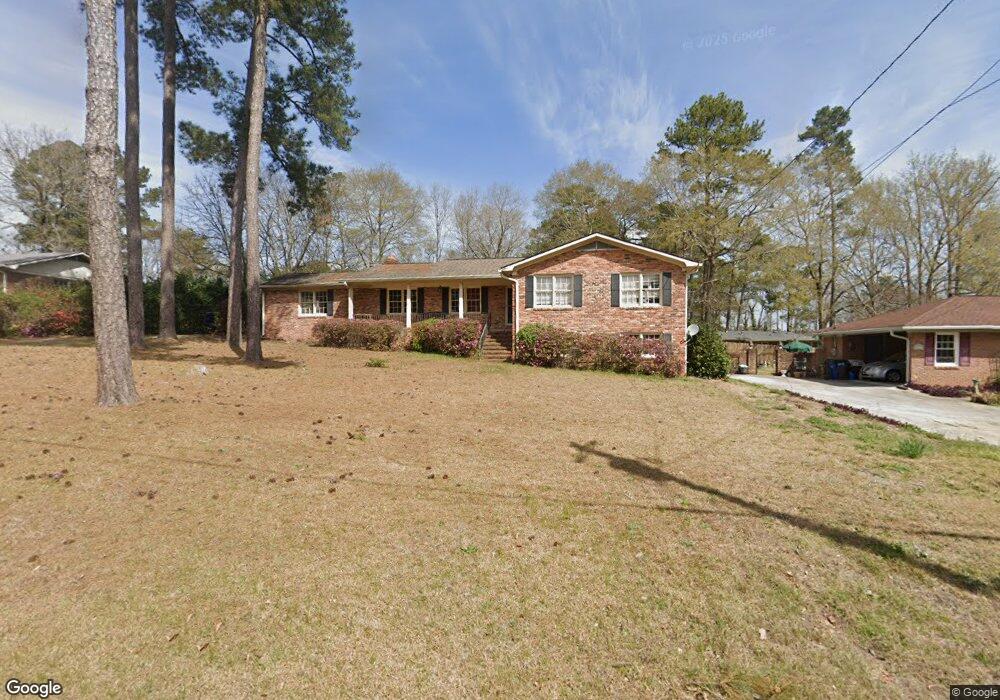
1008 Hill Place Macon, GA 31210
Estimated Value: $205,000 - $227,000
4
Beds
3
Baths
3,492
Sq Ft
$62/Sq Ft
Est. Value
About This Home
This home is located at 1008 Hill Place, Macon, GA 31210 and is currently estimated at $214,928, approximately $61 per square foot. 1008 Hill Place is a home located in Bibb County with nearby schools including Lane Elementary School, Howard Middle School, and Howard High School.
Ownership History
Date
Name
Owned For
Owner Type
Purchase Details
Closed on
May 22, 2023
Sold by
Moyston Livingston S
Bought by
Moyston Livingston S
Current Estimated Value
Home Financials for this Owner
Home Financials are based on the most recent Mortgage that was taken out on this home.
Original Mortgage
$166,870
Outstanding Balance
$162,051
Interest Rate
6.39%
Mortgage Type
FHA
Estimated Equity
$52,877
Purchase Details
Closed on
Nov 20, 2009
Sold by
Moyston Livingston S
Bought by
Moyston Livingston S and Baisden Moyston Carmen
Home Financials for this Owner
Home Financials are based on the most recent Mortgage that was taken out on this home.
Original Mortgage
$116,844
Interest Rate
4.94%
Mortgage Type
FHA
Purchase Details
Closed on
Mar 27, 2009
Sold by
Howard Michael A
Bought by
Security Bank Of Jones County
Purchase Details
Closed on
Sep 7, 2004
Home Financials for this Owner
Home Financials are based on the most recent Mortgage that was taken out on this home.
Original Mortgage
$132,600
Interest Rate
5.78%
Mortgage Type
Unknown
Create a Home Valuation Report for This Property
The Home Valuation Report is an in-depth analysis detailing your home's value as well as a comparison with similar homes in the area
Home Values in the Area
Average Home Value in this Area
Purchase History
| Date | Buyer | Sale Price | Title Company |
|---|---|---|---|
| Moyston Livingston S | $35,000 | 20/20 Title | |
| Moyston Livingston S | -- | None Available | |
| Moyston Livingston S | $119,000 | None Available | |
| Security Bank Of Jones County | -- | None Available | |
| -- | $131,000 | -- |
Source: Public Records
Mortgage History
| Date | Status | Borrower | Loan Amount |
|---|---|---|---|
| Open | Moyston Livingston S | $166,870 | |
| Previous Owner | Moyston Livingston S | $116,844 | |
| Previous Owner | -- | $132,600 |
Source: Public Records
Tax History Compared to Growth
Tax History
| Year | Tax Paid | Tax Assessment Tax Assessment Total Assessment is a certain percentage of the fair market value that is determined by local assessors to be the total taxable value of land and additions on the property. | Land | Improvement |
|---|---|---|---|---|
| 2025 | $1,714 | $69,768 | $11,180 | $58,588 |
| 2024 | $1,658 | $65,284 | $11,180 | $54,104 |
| 2023 | $1,527 | $58,557 | $11,180 | $47,377 |
| 2022 | $1,904 | $62,007 | $8,272 | $53,735 |
| 2021 | $1,785 | $53,966 | $6,948 | $47,018 |
| 2020 | $1,769 | $52,552 | $6,948 | $45,604 |
| 2019 | $1,562 | $46,896 | $6,948 | $39,948 |
| 2018 | $2,320 | $42,699 | $6,287 | $36,412 |
| 2017 | $1,245 | $40,224 | $6,640 | $33,584 |
| 2016 | $1,088 | $38,457 | $6,640 | $31,817 |
| 2015 | $1,541 | $38,457 | $6,640 | $31,817 |
| 2014 | $1,848 | $38,898 | $7,378 | $31,520 |
Source: Public Records
Map
Nearby Homes
- 870 Glen Hill Ct
- 1161 Ousley Place
- 3678 Northside Dr
- 3640 Northside Dr
- 3622 Northside Dr
- 4070 Carrie Ct
- 859 Forest Lake Dr S
- 3602 Northside Dr
- 4015 Elnora Dr
- 1344 Lake Valley Rd
- 1270 Lake Valley Rd
- 825 Forest Lake Dr S
- 3658 Northside Dr
- 1197 Matthews Place
- 3500 Northside Dr
- 1246 Newport Rd
- 1224 Timberlane Dr
- 938 Lundy Terrace
- 753 Lokchapee Dr
- 731 Lokchapee Dr
- 1018 Hill Place
- 1000 Hill Place
- 1015 Underwood Dr
- 1027 Underwood Dr
- 1005 Underwood Dr
- 1028 Hill Place
- 1009 Hill Place
- 1019 Hill Place
- 1001 Hill Place
- 1039 Underwood Dr
- 996 Hill Place
- 1037 Hill Place
- 1036 Hill Place
- 0 Underwood Dr Unit 7468841
- 0 Underwood Dr Unit 8121300
- 0 Underwood Dr Unit 7074661
- 989 Underwood Dr
- 1049 Underwood Dr
- 1016 Underwood Dr
- 1016 Underwood Dr Unit 403