Estimated Value: $571,000 - $656,000
3
Beds
3
Baths
2,196
Sq Ft
$279/Sq Ft
Est. Value
About This Home
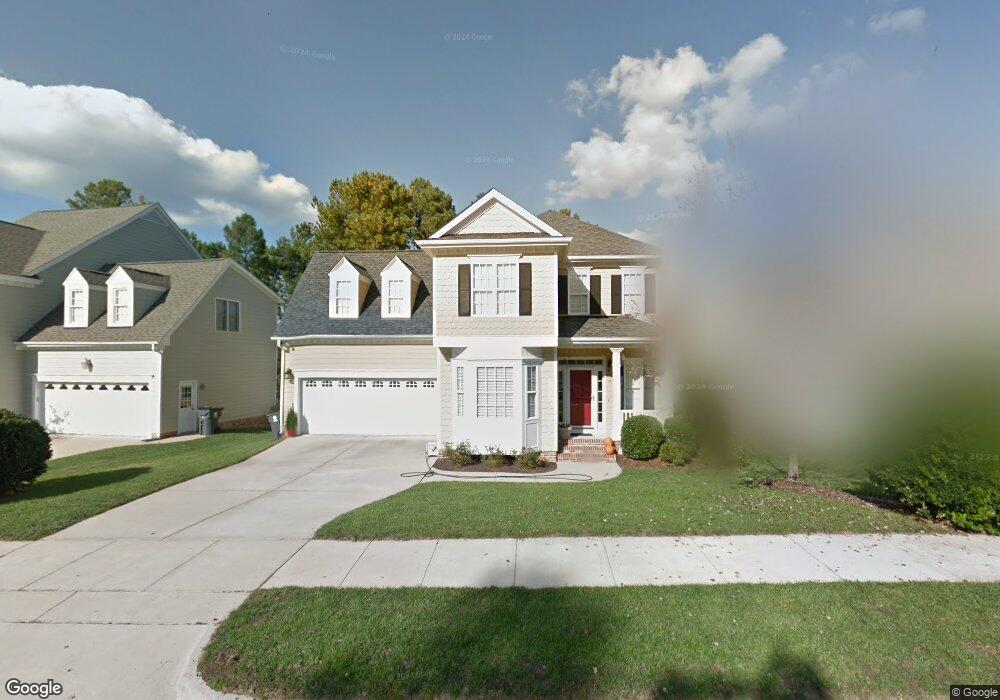
This home is located at 1008 Manderston Ln, Apex, NC 27502 and is currently estimated at $612,631, approximately $278 per square foot. 1008 Manderston Ln is a home located in Wake County with nearby schools including Scotts Ridge Elementary School, Apex Middle, and Apex High School.
Ownership History
Date
Name
Owned For
Owner Type
Purchase Details
Closed on
Feb 25, 2026
Sold by
Saulles Randi and Martin Steven S
Bought by
Martin & Saulles Revocable Family Trust and Martin
Current Estimated Value
Purchase Details
Closed on
Dec 20, 2017
Sold by
Howard Daniel N and Howard Kathryn D
Bought by
Saulles Randi E and Martin Steven S
Home Financials for this Owner
Home Financials are based on the most recent Mortgage that was taken out on this home.
Original Mortgage
$346,750
Interest Rate
3.9%
Mortgage Type
New Conventional
Purchase Details
Closed on
May 7, 2012
Sold by
Howard Kathryn D and Page Kathryn D
Bought by
Howard Kathryn D
Home Financials for this Owner
Home Financials are based on the most recent Mortgage that was taken out on this home.
Original Mortgage
$187,500
Interest Rate
2.62%
Mortgage Type
Adjustable Rate Mortgage/ARM
Purchase Details
Closed on
May 29, 2002
Sold by
Jvi Construction Inc
Bought by
Page Kathryn D
Home Financials for this Owner
Home Financials are based on the most recent Mortgage that was taken out on this home.
Original Mortgage
$183,200
Interest Rate
6%
Create a Home Valuation Report for This Property
The Home Valuation Report is an in-depth analysis detailing your home's value as well as a comparison with similar homes in the area
Purchase History
| Date | Buyer | Sale Price | Title Company |
|---|---|---|---|
| Martin & Saulles Revocable Family Trust | -- | None Listed On Document | |
| Saulles Randi E | $365,000 | None Available | |
| Howard Kathryn D | -- | None Available | |
| Page Kathryn D | $229,000 | -- |
Source: Public Records
Mortgage History
| Date | Status | Borrower | Loan Amount |
|---|---|---|---|
| Previous Owner | Saulles Randi E | $346,750 | |
| Previous Owner | Howard Kathryn D | $187,500 | |
| Previous Owner | Page Kathryn D | $183,200 |
Source: Public Records
Tax History
| Year | Tax Paid | Tax Assessment Tax Assessment Total Assessment is a certain percentage of the fair market value that is determined by local assessors to be the total taxable value of land and additions on the property. | Land | Improvement |
|---|---|---|---|---|
| 2025 | -- | $569,586 | $180,000 | $389,586 |
| 2024 | $4,881 | $569,586 | $180,000 | $389,586 |
| 2023 | $4,063 | $368,582 | $73,000 | $295,582 |
| 2022 | $3,815 | $368,582 | $73,000 | $295,582 |
| 2021 | $3,669 | $368,582 | $73,000 | $295,582 |
| 2020 | $3,632 | $368,582 | $73,000 | $295,582 |
| 2019 | $3,511 | $307,359 | $73,000 | $234,359 |
| 2018 | $3,307 | $307,359 | $73,000 | $234,359 |
| 2017 | $3,078 | $307,359 | $73,000 | $234,359 |
| 2016 | $3,034 | $300,478 | $73,000 | $227,478 |
| 2015 | $2,876 | $284,308 | $68,000 | $216,308 |
| 2014 | -- | $284,308 | $68,000 | $216,308 |
Source: Public Records
Map
Nearby Homes
- 809 Town Side Dr
- 1224 Tartarian Trail
- 517 Village Loop Dr
- 3013 White Cloud Cir
- 101 Rocklyn Ln
- 0 Jb Morgan Rd Unit 10051948
- 1210 Evian Ct
- 400 Village Loop Dr
- 105 Garden Side Way
- 107 Maple Crest Ct
- 710 Mid Summer Ln
- 440 Oak Pine Dr
- 1305 Olde Walker Mill Rd
- 1314 Chenworth Dr
- 1400 Applethorn Dr
- 470 Magdala Place
- 113 Curley Maple Ct
- 100 Henson Place
- 1200 Fairfax Woods Dr
- 1818 Porch Swing Way
- 1012 Manderston Ln
- 1016 Manderston Ln
- 1109 Dalgarven Dr
- 1201 Dalgarven Dr
- 1105 Dalgarven Dr
- 1209 Dalgarven Dr
- 1217 Dalgarven Dr
- 1101 Dalgarven Dr
- 1017 Manderston Ln
- 1020 Manderston Ln
- 1221 Dalgarven Dr
- 1021 Manderston Ln
- 1009 Manderston Ln
- 1013 Manderston Ln
- 1005 Manderston Ln
- 1225 Dalgarven Dr
- 1025 Manderston Ln
- 1001 Manderston Ln
- 1024 Manderston Ln
- 1229 Dalgarven Dr
Your Personal Tour Guide
Ask me questions while you tour the home.