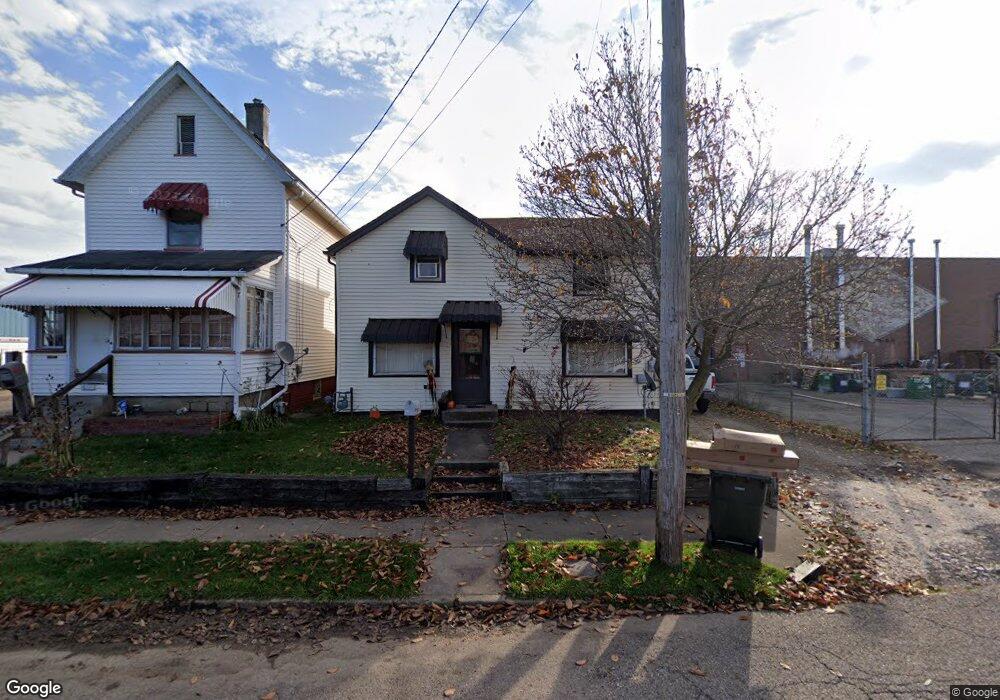
1008 Marion Ave SW Canton, OH 44707
Old Southwest NeighborhoodEstimated Value: $57,013 - $98,000
3
Beds
1
Bath
1,184
Sq Ft
$64/Sq Ft
Est. Value
About This Home
This home is located at 1008 Marion Ave SW, Canton, OH 44707 and is currently estimated at $75,253, approximately $63 per square foot. 1008 Marion Ave SW is a home located in Stark County with nearby schools including Early Learning Center @ Schreiber, Cedar Elementary School, and Clarendon Intermediate School.
Ownership History
Date
Name
Owned For
Owner Type
Purchase Details
Closed on
Jul 6, 2021
Sold by
James Delgado
Bought by
Hill Ronald
Current Estimated Value
Purchase Details
Closed on
Sep 2, 2016
Sold by
Ayers Eva and Hardman Tiana
Bought by
Putterman Melissa Anne
Purchase Details
Closed on
Jun 30, 2011
Sold by
Ayers Eva and Ayers Dan
Bought by
Ayers Tiana and Ayers Eva
Purchase Details
Closed on
Jan 18, 2011
Sold by
Ayers Tiana
Bought by
Ayers Eva
Purchase Details
Closed on
Apr 16, 2008
Sold by
Dechiara Sharon and Brown Michael R
Bought by
Ayers Eva and Ayers Tiana
Purchase Details
Closed on
Mar 21, 2008
Sold by
Estate Of Bernice V Brown
Bought by
Brown Michael R and Dechiara Sharon
Purchase Details
Closed on
Nov 19, 2007
Sold by
Estate Of Harry Brown
Bought by
Brown Bernice
Create a Home Valuation Report for This Property
The Home Valuation Report is an in-depth analysis detailing your home's value as well as a comparison with similar homes in the area
Home Values in the Area
Average Home Value in this Area
Purchase History
| Date | Buyer | Sale Price | Title Company |
|---|---|---|---|
| Hill Ronald | -- | None Listed On Document | |
| Putterman Melissa Anne | $8,700 | None Available | |
| Ayers Tiana | -- | Attorney | |
| Ayers Eva | -- | Attorney | |
| Ayers Eva | $10,000 | Attorney | |
| Brown Michael R | -- | None Available | |
| Brown Bernice | -- | None Available |
Source: Public Records
Tax History Compared to Growth
Tax History
| Year | Tax Paid | Tax Assessment Tax Assessment Total Assessment is a certain percentage of the fair market value that is determined by local assessors to be the total taxable value of land and additions on the property. | Land | Improvement |
|---|---|---|---|---|
| 2025 | -- | $6,300 | $2,170 | $4,130 |
| 2024 | $306 | $6,300 | $2,170 | $4,130 |
| 2023 | $1,098 | $5,250 | $1,330 | $3,920 |
| 2022 | $310 | $5,250 | $1,330 | $3,920 |
| 2021 | $313 | $5,250 | $1,330 | $3,920 |
| 2020 | $295 | $4,420 | $1,160 | $3,260 |
| 2019 | $258 | $4,420 | $1,160 | $3,260 |
| 2018 | $259 | $4,420 | $1,160 | $3,260 |
| 2017 | $377 | $5,890 | $1,090 | $4,800 |
| 2016 | $388 | $5,890 | $1,090 | $4,800 |
| 2015 | $390 | $5,890 | $1,090 | $4,800 |
| 2014 | $400 | $5,670 | $1,050 | $4,620 |
| 2013 | $195 | $5,670 | $1,050 | $4,620 |
Source: Public Records
Map
Nearby Homes
- 1016 Clinton Ave SW
- 1334 Margaret Ave SW
- 1017 Clinton Ave SW
- 1356 Margaret Ave SW
- 817 Prospect Ave SW
- 719 Prospect Ave SW
- 646 Dueber Ave SW
- 1215 Dueber Ave SW
- 1219 Dueber Ave SW
- 1507 & 1511 Stark Ave SW
- 1024 3rd St NW
- 633 Park Ave SW
- 1021 Greenfield Ave SW
- 1227 Greenfield Ave SW
- 1015 4th St NW
- 413 Newton Ave NW
- 631 Greenfield Ave SW
- 1033 Monnot Place NW
- 1001 Harrison Ave SW
- 916 6th St NW
- 1006 Marion Ave SW
- 1007 High Ave SW
- 600 Dent Place SW
- 916 High Ave SW
- 932 Wells Ave SW
- 910 High Ave SW
- 1100 High Ave SW
- 612 9th St SW
- 612 9th St SW
- 909 Wells Ave SW
- 830 Marion Ave SW
- 606 9th St SW
- 711 9th St SW
- 801 9th St SW
- 805 9th St SW
- 817 High Ave NW
- 910 Wells Ave SW
- 707 9th St SW
- 600 9th St SW
- 1119 Mckinley Ave SW