1008 Myers Rd Centralia, IL 62801
Estimated Value: $110,000 - $160,000
3
Beds
2
Baths
1,250
Sq Ft
$106/Sq Ft
Est. Value
About This Home
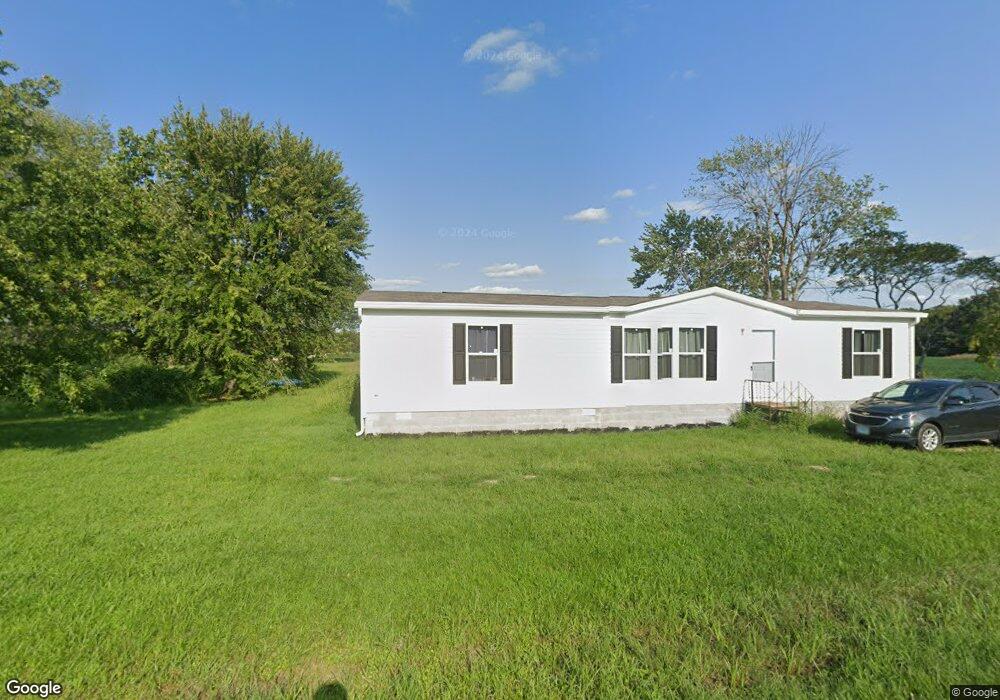
This home is located at 1008 Myers Rd, Centralia, IL 62801 and is currently estimated at $132,421, approximately $105 per square foot. 1008 Myers Rd is a home located in Marion County with nearby schools including Racoon Grade School and Centralia High School.
Ownership History
Date
Name
Owned For
Owner Type
Purchase Details
Closed on
Jan 9, 2009
Sold by
Winkler Melinda J and Winkler Shelby R
Bought by
Fisher Pamette
Current Estimated Value
Home Financials for this Owner
Home Financials are based on the most recent Mortgage that was taken out on this home.
Original Mortgage
$52,530
Outstanding Balance
$33,662
Interest Rate
5.44%
Mortgage Type
FHA
Estimated Equity
$98,759
Purchase Details
Closed on
Aug 22, 2007
Sold by
Ramey Timothy L and Bryan Connie L
Bought by
Winkler Melinda J and Winkler Shelby R
Purchase Details
Closed on
Jun 15, 2006
Sold by
Federal Home Loan Mortgage Assn
Bought by
Ramey Timothy L and Bryan Connie L
Home Financials for this Owner
Home Financials are based on the most recent Mortgage that was taken out on this home.
Original Mortgage
$33,200
Interest Rate
6.68%
Mortgage Type
New Conventional
Purchase Details
Closed on
Nov 28, 2005
Sold by
Burnett Bonnie
Bought by
Federal Home Loan Mortgage Corporation
Create a Home Valuation Report for This Property
The Home Valuation Report is an in-depth analysis detailing your home's value as well as a comparison with similar homes in the area
Home Values in the Area
Average Home Value in this Area
Purchase History
| Date | Buyer | Sale Price | Title Company |
|---|---|---|---|
| Fisher Pamette | $26,750 | Quad County Title Co Inc | |
| Winkler Melinda J | $23,500 | Quad County Title Co Inc | |
| Ramey Timothy L | -- | Anthony Title Services | |
| Federal Home Loan Mortgage Corporation | -- | None Available |
Source: Public Records
Mortgage History
| Date | Status | Borrower | Loan Amount |
|---|---|---|---|
| Open | Fisher Pamette | $52,530 | |
| Previous Owner | Ramey Timothy L | $33,200 |
Source: Public Records
Tax History Compared to Growth
Tax History
| Year | Tax Paid | Tax Assessment Tax Assessment Total Assessment is a certain percentage of the fair market value that is determined by local assessors to be the total taxable value of land and additions on the property. | Land | Improvement |
|---|---|---|---|---|
| 2024 | $1,396 | $28,970 | $4,120 | $24,850 |
| 2023 | $1,381 | $27,070 | $3,850 | $23,220 |
| 2022 | $1,336 | $24,610 | $3,500 | $21,110 |
| 2021 | $1,299 | $23,000 | $3,270 | $19,730 |
| 2020 | $1,226 | $22,320 | $3,180 | $19,140 |
| 2019 | $1,183 | $21,500 | $3,060 | $18,440 |
| 2018 | $1,172 | $20,870 | $2,430 | $18,440 |
| 2017 | $1,160 | $20,460 | $2,380 | $18,080 |
| 2016 | $1,129 | $19,670 | $2,290 | $17,380 |
| 2015 | $11 | $19,670 | $2,290 | $17,380 |
| 2012 | $11 | $19,290 | $2,250 | $17,040 |
Source: Public Records
Map
Nearby Homes
- 1000 Medlin Rd
- 1319 Medlin Rd
- 920 Illinois 37
- 1251 State Route 37
- 1027 Cody Rd
- 2562 State Route 161
- 2030 Gierten Rd
- 00000 Gierten Rd
- 520 Deerfield Rd Unit 102 Road
- 520 Deerfield Rd
- 1080 Race Track Rd
- 3255 Glacier Ln
- 2345 Copple Rd
- 3287 Cumberland Ln
- 3373 Rainier Ln
- 4538 Harris Rd
- 2720 Miles Ln
- 4308 Church Rd
- 22035 N Old Centralia Ln
- 9559 E Dix Irvington Rd
- 1103 Mount Moriah Rd
- 1123 Mount Moriah Rd
- 1128 Myers Rd
- 900 Mount Moriah Rd
- 1159 Myers Rd
- 3576 Illinois 161
- 3630 State Route 161
- 3576 State Route 161
- 3534 State Route 161
- 3546 Illinois 161
- 3708 State Route 161
- 3549 Bernard Rd
- 3530 Bernard Rd
- 3480 Bernard Rd
- 3840 State Route 161
- 796 Myers Rd
- 3446 Bernard Rd
- 3422 Bernard Rd
- 3800 Block State Route 161
- 3429 Bernard Rd